
Querying Map-Projected Images
QUESTION: I read your article on interactively querying images, but my image is in a map projection. Is is possible to interactively query this kind of an image, and to display continental outlines and map grids on the image simultaneously?
![]()
ANSWER: Yes, as of 4 January 2009, with the addition of a map coordinate object, named MapCoord, to the Catalyst Library, it is now possible to associate a map projection data coordinate space with an image. Once this is done, the Catalyst Library program, ImgWin will report the data cursor location in the image in latitude and longitude coordinates.
For example, here is a MODIS image that I obtained from the National Snow and Ice Data Center (NSIDC) as satellite swath data, which I gridded and projected into a polar equal-area EASE grid (which is a Lambert Equal-Area projection, centered on the north pole). I wanted to view this image in a re-sizeable graphics window, with continental outlines and grid overlays so I could oriented myself within the image. The image, after I had processed it, contained 9600 columns and 5760 rows in a rectangular array. I knew, because of the way I had gridded it, that the origin of the grid was at (-2400000, -1440000) meters in UV coordinates, and that the scale of the grid was 500 meters/pixel.
Thus, I was able to set up my map projection space, using the Catalyst Library MapCoord object, which is essentially a wrapper for the Map_Proj_Init function, like this.
    mapCoords = Obj_New('MapCoord', 111, SPHERE_RADIUS=6371228L, $
      CENTER_LATITUDE=90.0, CENTER_LONGITUDE=0.0)    xorigin = -2400000.0D
   yorigin = -1440000.0D    xend = xorigin + (9600L * 500)
   yend = yorigin + (5760L * 500)    xrange = [xorigin, xend]
   yrange = [yorigin, yend]
   mapCoords -> SetProperty, XRANGE=xrange, YRANGE=yrange
Catalyst coordinate objects simply associate a data coordinate space (in this case, a map projection space) with a rectangular area of the output graphics window. But once the space is created, Catalyst display windows allow interactive inquery of the data location, which can immediately be turned into an image value by asking Catalyst image objects to return their value at that location in the window.
Before I create the image object, however, I would like to set up some colors for the image. I do that like this.
colors = Obj_New('CatColors', BREWER=1, INDEX=4)
Now I am ready to create the image object, passing it both the map coordinate object and the color object. I am going to use a ScaleImage object because the original image data is in the range of 0 to 1. This particular image I want to scale into the range of 0.0 to 0.45 for display.
    imageObj = Obj_New('ScaleImage', image, SCLMIN=0.0, SCLMAX=0.45,  $
        COORD_OBJECT=mapCoords, COLOR_OBJECT=colors)
If I displayed the image object now, it would report the cursor position in latitude and longitude coordinates, but I would not have land boundaries or map grids displayed on the image. And, of course, the MapCoords object cannot really draw land boundaries or map grids. It can only set up a map projection data coordinate space.
I could, of course, just draw map boundaries now with Map_Continents or Map_GSHHS_Shoreline, and I could draw map grids with Map_Grid, since I have already set up my map projection space. But if I re-sized my graphics window, I would have to do this all over again, so I would like to automate this process.
To make this possible, I have added two additional objects to the Catalyst Library. Map_Outline is an object for drawing land boundaries on map projections (or images). Essentially, this is a wrapper for either the IDL Map_Continents command, or the Map_GSSHS_Shoreline command from the Coyote Library. And the Map_Grid object is a similar wrapper for the IDL Map_Grid command. Basically, calling the Draw method on either of these objects is like calling Map_Continents or Map_Grid, respectively.
Now, here is the interesting part. The MapCoord object has the ability to store either of these two objects (or none, depending on what you want to do). If the MapCoord object is storing one or both of these two objects, then the CatImage object in the Catalyst Library (SelectImage is sub-classed from this object) will remove the objects from storage after displaying the image and call the draw methods on the objects. This gives you the opportunity to draw land outlines and map grids on your image.
For my purposes, I create the Map_Outline and Map_Grid objects and store them in the MapCoord object like this.
   outline = Obj_New('Map_Outline', MAP_OBJECT=mapCoords, COLOR='indian red')
   grid = Obj_New('Map_Grid', MAP_OBJECT=mapCoords, COLOR='charcoal')
   mapCoords -> SetProperty, OUTLINE_OBJECT=outline, GRID_OBJECT=grid
Now, I am ready to display the image object, using ImgWin.
ImgWin, imageObj, /WIN_KEEP_ASPECT
You can see the output in the figure below. Note that the image value is printed out along with the pixel coordinate (Pix Loc: (6539,4236)), and the map location in latitude and longitude (Data Loc: (127.95, 80.07)).
 |
| Map outlines and grids drawn on a map-projected image. |
If you wish to use the new MapCoord object be sure to download a new Catalyst Library zip file. The file mapcoord__define.pro will be found in the coordinates sub-directory, and the files map_outline__define.pro and map_grid__define.pro will be found in the graphics sub-directory. You will also need to update your catimage__define.pro file, found in the data sub-directory.
Users of NSIDC Map-Projected Images
Many users of map-projected images download them from the National Snow and Ice Data Center (NSIDC). If you use these images, you may be interested in a Catalyst Library application, named DataViewer, that can be used to display some of the images available from NSIDC. (Additional images are being added to the DataViewer all the time. If your image isn't among the ones that can be read, please contact me and I will see if I can find the time to add it. DataViewer is an on-going application at NSIDC and changes are being made to it on a regular basis.) You can find out which images are currently read by the DataViewer by reading the ReadMe file associated with the program.
With the DataViewer you can open any number of images, include entire image directories and view them as single images, or in a user-definable grid of up to 8 by 8 images. Images can be manipulated from within the DataViewer, and multiple images can be animated. (Any image that can be read with Read_Image can be read with the DataViewer, although only NSIDC map-projected images can be displayed with map and grid overlays.)
If you wish to install the DataViewer program, you can find the source code on my web page. To run the program, you will need both the Coyote and Catalyst Libraries installed and on your IDL path. You can also download a few sample data files to view with the DataViewer. Here is a picture of the DataViewer in operation in the figure below.
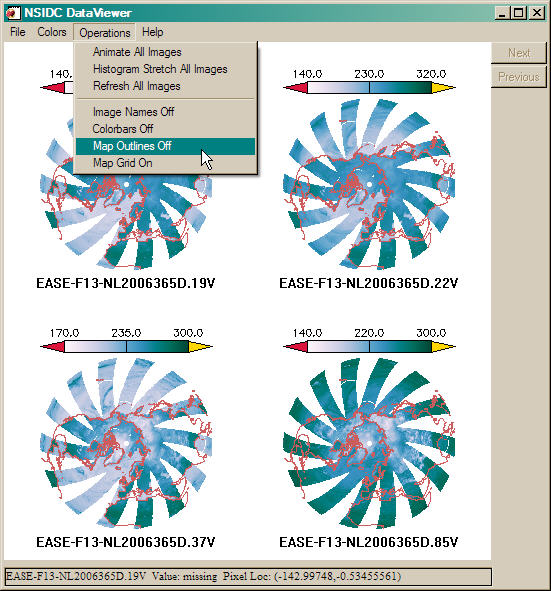 |
| The NSIDC DataViewer program allows map outlines and map grids on the images it reads. |
![]()
Version of IDL used to prepare this article: IDL 7.0.3.
![]()
Copyright © 2009 David W. Fanning
Written: 4 January 2009
Updated: 18 May 2011