
Scaling For Image Display
QUESTION: I have some image data, and the data values range from -1.7 to 5.5. I would like to display this image with a diverging color table that is white (or nearly so) at 0.0 and goes to different diverging colors at either end of the scale. And I want equivalent scaling. In other words, I want the values -1.5 and 1.5 to be scaled with the same relative color brighness, just with different colors. Is there an easy way to do this in IDL?
![]()
ANSWER: You better believe it! This is very easily done with the Coyote Library routines cgScaleVector, to scale the data, and CTLoad, to load a diverging Brewer color table for the image display.
The data is easily scaled, like this.
scaledImage = cgScaleVector(data, 0, 255, MINVALUE=-5.5, MAXVALUE=5.5)
Actually, good ol’ BytScl will work here, too, although it is hard not to put a plug in for cgScaleVector, since I think that is a much more useful program than a lot of people realize.
scaledImage = BytScl(data, MIN=-5.5, MAX=5.5)
You can load a diverging Gold-Green Brewer color table and display your image, with a color bar, like this. (Note that if you run in Indexed Color mode (Device, Decomposed=0) that the code below will include a line in your image, draw in the background color. This is a bug (reported to me, since I don't ever run my programs in Indexed Color mode!) and has been fixed in a May 28th, 2008 update to TVImage.)
    cgLoadCT, 19, /BREWER    pos = [0.1, 0.1, 0.9, 0.8]
   cgImage, scaledImage, /KEEP_ASPECT, POSITION=pos, Erase=1, $
      BACKGROUND='rose', /AXES, ACOLOR='navy', $
      AXKEYWORDS={TICKLEN: -0.025, FONT: 0}
   cgColorbar, POSITION=[pos[0], 0.9, pos[2], 0.95], $
      RANGE=[-5.5, 5.5], FORMAT='(F5.2)', DIVISIONS=4, $
      ANNOTATECOLOR='NAVY', FONT=0
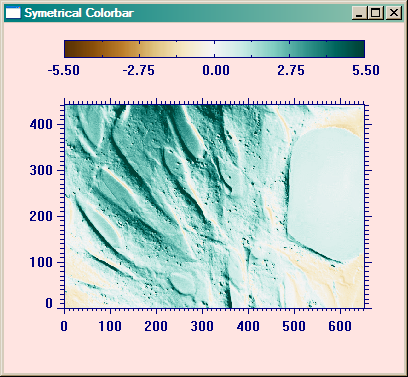 |
| The image data with equivalent scaling in positive and negative directions. |
You can find descriptions of all the programs you need to do this kind of image scaling in the Coyote Library. Or you can simply download a zip file of all the Coyote Library programs.
![]()
QUESTION: Sure, sure. But I want a non-symetrical color table with diverging colors. In other words, I want the 0 in the color table to be offset, the way it is in my data. How can I do that?
![]()
ANSWER: This answer comes from Matt Savoie who is often (much to my chagrin) coming up with some incredible insight into one of my programs after I've embarrassed myself by publishing the darn thing. (Actually, he saves me from more embarrassment than he causes.) Anyway, the secret here is to scale the color bar range in the same way you scale the data, then use the color bar range to calculate the BOTTOM and NCOLORS keywords to the FSC_Colorbar command.
For example, consider these commands.
   scaledImage = cgScaleVector(data, 0, 255, MINVALUE=-5.5, MAXVALUE=5.5)
   cb_scaled = cgScaleVector([-1.7, 5.5], 0, 255, MINVALUE=-5.5, MAXVALUE=5.5)
   cgLoadCT, 19, /BREWER    pos = [0.1, 0.1, 0.9, 0.8]
   cgImage, scaledImage, /KEEP_ASPECT, POSITION=pos, Erase=1, $
      BACKGROUND='rose', /AXES, ACOLOR='navy', $
      AXKEYWORDS={TICKLEN: -0.025, FONT: 0}
   cgColorbar, POSITION=[pos[0], 0.9, pos[2], 0.95], $
      RANGE=[-1.7, 5.5], ANNOTATECOLOR='NAVY', FONT=0, $
      BOTTOM=Round(cb_scaled[0]), NCOLORS=(cb_scaled[1] - cb_scaled[0]) + 1, $
      TICKNAMES=['-1.7', '0.0', '5.5'], XTICKV=[-1.7, 0.0, 5.5], XMINOR=0
You see the results in the figure below.
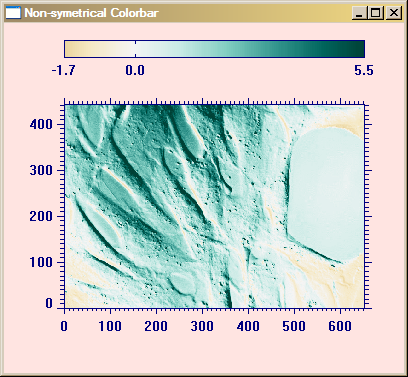 |
| The image data with equivalent scaling, but unequal color bar. |
![]()
Version of IDL used to prepare this article: IDL 7.0.1.
![]()
Copyright © 2008 David W. Fanning
Last Updated 16 June 2008