
Colorbar Annotation
QUESTION: Your cgColorbar routine is very helpful, but I want to annotate it with my own string labels and I can't see how to do it. Can you help?
![]()
ANSWER: The cgColorbar routine is really just a glorified Plot command, so you can use almost all of the keywords you would use for the Plot command to label it. In particular, you can use the [XY]Tickformat keywords to perform elaborate tick formatting, based on a program you write yourself.
A short example will probably be the best way to explain this. Suppose you wanted to label the color bar with the labels "Lowest", "Lower", "Middle", "Higher" and "Highest", and that these values in your application corresponded to the values 10, 30, 70, 85, and 100, respectively. You might create a tick formatting function to represent these values like this:
   FUNCTION Colorbar_Annotate, axis, index, value
   text = ['','Lowest', 'Lower', 'Middle', 'Higher', 'Highest']
   possibleval = [ 0, 10, 30, 70, 85, 100]
   selection = Where(possibleval eQ value)
   IF selection[0] EQ -1 THEN RETURN, "" ELSE $
      RETURN, (text[selection])[0]
   END
This function just returns the string value associated with a particular axis value. Note that you must provide a string value for the first value on the axis. Here, we make the string a null string, because we dont really want that value labelled.
To use the function with cgColorbar we do something like this:
   cgDisplay, 500, 75, Title='Colorbar Annotation Example'
   LoadCT, 33
   cgColorbar, XTickV=[10, 30, 70, 85, 100], Range=[0,100], $
      XTickformat='colorbar_annotate', XMinor=0, $
       Position=[0.1, 0.35, 0.9, 0.85], Font=0
The results are shown in the illustration below.
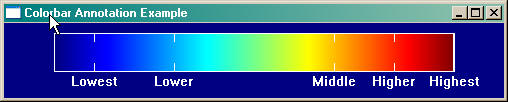
![]()
Last Updated 26 August 2005