| Overplot nice looking globe on 2d satellite images [message #52312] |
Sat, 27 January 2007 10:11 |
 Brian Larsen
Messages: 270
Registered: June 2006
|
Senior Member |
|
|
All,
I imagine this is not too hard but I haven't been able to figure it
out. What I want to do is in the center of a polar contour plot
overplot a nice looking globe that can be turned and tilted to the
correct perspective and shaded to show where the sun is.
The definition of nice looking depends on the difficulty involved, if
it is hard, nice could be something like this
MAP_SET,90,0,0,/ORTHOGRAPHIC,/ISOTROPIC,/GRID, /CONTINENTS,/HORIZON,
$ E_continents={FILL:1}
where one could do the shading done with white oceans and back
continents on one side and the other way around on the other or the
like. But if it isn't too hard nice could be a lot better,
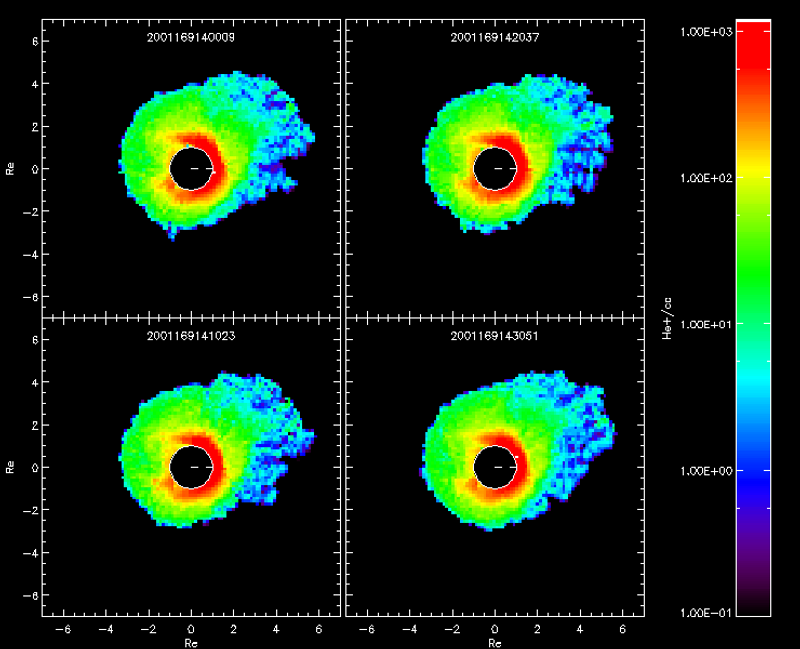
The images that I have are a decreasing intensity profile out around
the earth plotted in earth radii looking down from the north pole. So
the overplotted globe will fill the 1,1 Re center of the plot that
goes from -6,6 or so.
I posted a couple of the images here:
http://solar.physics.montana.edu/larsen/2001169140009_sims.p ng
Imagine how much better it would look with a globe in the center
instead of the boring blacked out circle I have with the line to point
to the sun.
One thing that seems hard to do with the map routines (that I am a
major novice at using as I really only look at space data with a
little earth in the center) are that I see no easy way to make a globe
take up -1,1 in a plot and leave the other stuff plotted around it.
I have hunted in the normal places (dfanning.com, michaelgalloy.com,
and all) with any luck.
Anyone done something like this before and have a handy post or page
somewhere about this?
Cheers,
Brian
------------------------------------------------------------ -----------
----
Brian A. Larsen
Dept. of Physics
Space Science and Engineering Lab (SSEL)
Montana State University - Bozeman
Bozeman, MT 59717
|
|
|
|
 comp.lang.idl-pvwave archive
 Members
 Search
 Help
Help Login
Login Home
Home


")
