 comp.lang.idl-pvwave archive
Messages from Usenet group comp.lang.idl-pvwave, compiled by Paulo Penteado
 Members
 Search
 Help
Help Login
Login Home
Home|
Show:
Today's Messages
:: Show Polls
:: Message Navigator
E-mail to friend |
   |
| ||||||||||||||


 |
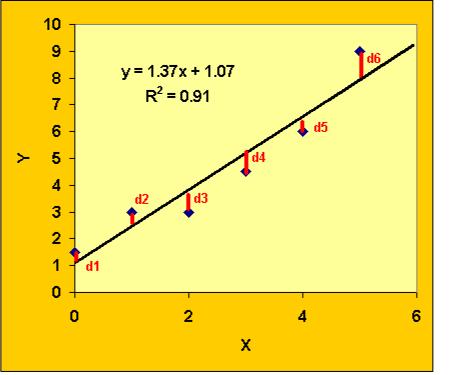
How to plot linear regression relation of two array?
By: Hu on Mon, 09 February 2009 11:45
|
| Previous Topic: | Re: How to read a multi-band image with IDL |
| Next Topic: | Re: How to plot linear regression relation of two array? |
-=] Back to Top [=-
")

Current Time: Tue Jun 09 18:50:37 PDT 2026
Total time taken to generate the page: 1.19819 seconds