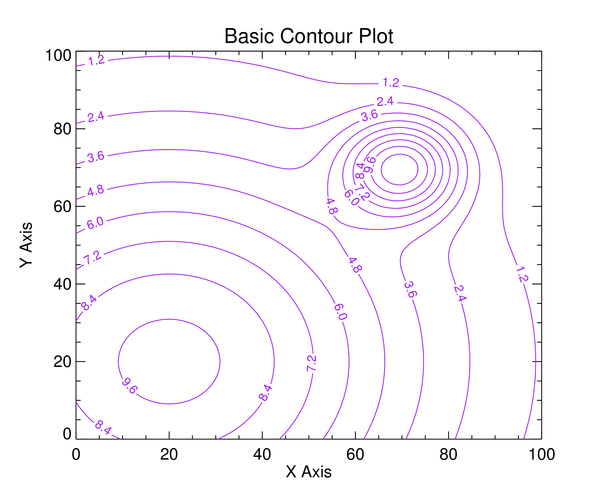
Basic Contour Plot
http://www.idlcoyote.com/gallery/basic_contour_plot.png
=================
Copy + Paste
=================
; Example Gaussian data.
data = cgDemoData(26)
; Set up variables for the contour plot. Normally, these values
; would be passed into the program as positional and keyword parameters.
minValue = Floor(Min(data))
nLevels = 10
xtitle = 'X Axis'
ytitle = 'Y Axis'
position = [0.125, 0.125, 0.9, 0.9]
title = 'Basic Contour Plot'
;Contour levels
contourLevels = cgConLevels(data, NLevels=10, MinValue=minValue)
; Open a window and return its reference to the user.
aWindow = Window(WINDOW_TITLE="Basic Contour Plot")
;Create a contour
fgContour = Contour(data, /Current, C_Value=contourLevels, C_Color='Purple', $
XTitle=xtitle, YTitle=ytitle, Title=title)
;Add the right and top axes
; In IDL 8.2.3+ set Location='Right' or 'Top' and skip finding [xy]range.
xrange = (fgContour.Axes)[0].Range
yrange = (fgContour.Axes)[1].Range
xAxis = Axis('X', Target=fgContour, Location=[xrange[1], yrange[1], 0], $
TickFormat='(A1)', TickDir=1)
yAxis = Axis('Y', Target=fgContour, Location=[xrange[1], yrange[0], 0], $
TickFormat='(A1)', TickDir=1)
=================
Coyote Version
=================
PRO Basic_Contour_Plot_FG, WINDOW=window
; Example Gaussian data.
data = cgDemoData(26)
; Set up variables for the contour plot. Normally, these values
; would be passed into the program as positional and keyword parameters.
minValue = Floor(Min(data))
nLevels = 10
xtitle = 'X Axis'
ytitle = 'Y Axis'
position = [0.125, 0.125, 0.9, 0.9]
title = 'Basic Contour Plot'
;Contour levels
contourLevels = cgConLevels(data, NLevels=10, MinValue=minValue)
; Open a window and return its reference to the user.
aWindow = Window(WINDOW_TITLE="Basic Contour Plot")
;Create a contour
fgContour = Contour(data, /Current, C_Value=contourLevels, C_Color='Purple', $
XTitle=xtitle, YTitle=ytitle, Title=title)
;Add the right and top axes
; In IDL 8.2.3+ set Location='Right' or 'Top' and skip finding [xy]range.
xrange = (fgContour.Axes)[0].Range
yrange = (fgContour.Axes)[1].Range
xAxis = Axis('X', Target=fgContour, Location=[xrange[1], yrange[1], 0], $
TickFormat='(A1)', TickDir=1)
yAxis = Axis('Y', Target=fgContour, Location=[xrange[1], yrange[0], 0], $
TickFormat='(A1)', TickDir=1)
END ;*********************************************************** ******
; This main program shows how to call the program and produce
; various types of output.
; Display the plot in a resizeable graphics window.
Basic_Contour_Plot_FG, Window=window
; Create a PostScript file. Linestyles are not preserved in IDL 8.2.3 due
; to a bug. Only encapsulated PostScript files can be created.
window.save, 'basic_contour_plot_fg.eps'
; Create a PNG file with a width of 600 pixels. Resolution of this
; PNG file is not very good.
window.save, 'basic_contour_plot_fg.png', WIDTH=600
; For better resolution PNG files, make the PNG full-size, then resize it
; with ImageMagick. Requires ImageMagick to be installed.
window.save, 'line_plot_with_legend_fullsize.png'
Spawn, 'convert basic_contour_plot_fg_fullsize.png -resize 600 basic_contour_plot_fg_resized.png'
END
|
 comp.lang.idl-pvwave archive
 Members
 Search
 Help
Help Login
Login Home
Home


")
