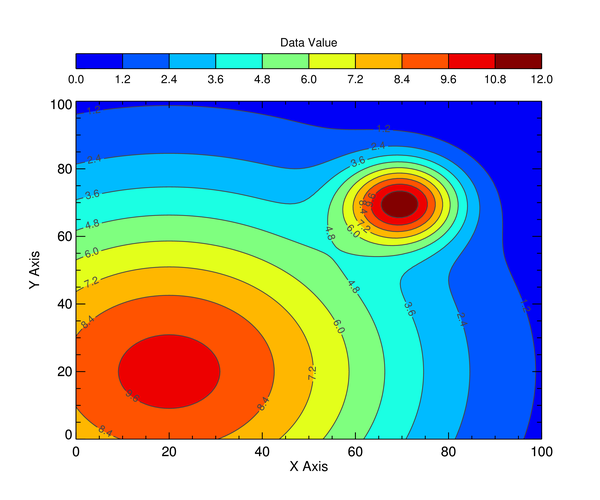
Filled Contour Plot
http://www.idlcoyote.com/gallery/filled_contour_plot_1.png
Several things that are not intuitive and are not explained in the documentation are happening in this one. I cannot precisely reproduce the Coyote version.
PRO Filled_Contour_Plot_FG, WINDOW=window
;Set up variables for the contour plot. Normally, these values
;would be passed into the program as positional and keyword parameters.
minValue = Floor(Min(data))
maxValue = Ceil(Max(data))
nLevels = 10
xtitle = 'X Axis'
ytitle = 'Y Axis'
position = [0.125, 0.125, 0.9, 0.800]
cbposition = [0.125, 0.865, 0.9, 0.895]
cbTitle = 'Data Value'
;Contour Levels
contourLevels = cgConLevels(data, NLevels=10, MinValue=minValue)
;Set up colors for contour plot.
cgLoadCT, 33, NColors=nlevels, Bottom=1, CLIP=[30,255]
TVLCT, palette, /GET
; Open a window and return its reference to the user.
aWindow = Window(WINDOW_TITLE="Filled Contour Plot")
;Draw the filled contour plot.
; - RGB_Table=33 works and creates a discretely filled contour plot. However,
; the TAPER keyword in Colorbar seems to need a non-continuous color pallete
; to not be ignored. Attept to use a reduced color palette failed.
fgC_Fill = Contour(data, /Current, /FILL, C_Value=contourLevels, RGB_Table=palette, $
XTitle=xtitle, YTitle=ytitle, Position=position)
;Must overplot another contour to get the lines.
; - Orientation of the labels is rotated 180 degrees.
; - Must supply own Text() or Symbol() object and use the
; C_Use_Label_Orientation and C_Label_Objects keywords to get proper orientation.
fgC_Lines = Contour(data, C_Value=contourLevels, OverPlot=fgC_Fill, C_Label_Show=1)
;Add the right and top axes
; In IDL 8.2.3+ set Location='Right' or 'Top' and skip finding [xy]range.
IF Float(!Version.Release) GE 8.3 THEN BEGIN
xrange = (fgC_Fill.Axes)[0].Range
yrange = (fgC_Fill.Axes)[1].Range
xAxis = Axis('X', Target=fgC_Fill, Location=[xrange[1], $
yrange[1], 0], TickFormat='(A1)', TickDir=1)
yAxis = Axis('Y', Target=fgC_Fill, Location=[xrange[1], $
yrange[0], 0], TickFormat='(A1)', TickDir=1)
ENDIF ELSE BEGIN
xAxis = Axis('X', Target=fgC_Fill, Location='Right', $
TickFormat='(A1)', TickDir=1)
yAxis = Axis('Y', Target=fgC_Fill, Location='Top', $
TickFormat='(A1)', TickDir=1)
ENDELSE
;Add the colorbar
; - The title and ticklabels are always on the same side. Try to use an Axis() instead
; - The Taper keyword is ignored: It is suppose to be ignored if the color table
; is continuous, but here, "palette" is reduced... Perhaps data is out of range? Do not see how...
; - TickFormat is ignored
fgCB = Colorbar(Target=fgC_Fill, Position=cbPosition, Title='Data Value', Taper=0, $
Border=1, TextPos=1, TickFormat='(A1)')
;Create an axis for the colorbar to try and put the ticklabels on the bottom.
; - It seems as though axes cannot have colorbars as targets...
; - cbAxis is undefined after attempt
; - No information is given as to what happened...
cbAxis = Axis('X', Target=fgCB, Location=[cbPosition[0:1], 0], Axis_Range=[minValue, maxValue])
END ;*********************************************************** ******
; This main program shows how to call the program and produce
; various types of output.
; Display the plot in a resizeable graphics window.
Filled_Contour_Plot_FG, Window=window
; Create a PostScript file. Linestyles are not preserved in IDL 8.2.3 due
; to a bug. Only encapsulated PostScript files can be created.
window.save, 'filled_contour_plot_fg.eps'
; Create a PNG file with a width of 600 pixels. Resolution of this
; PNG file is not very good.
window.save, 'filled_contour_plot_fg.png', WIDTH=600
; For better resolution PNG files, make the PNG full-size, then resize it
; with ImageMagick. Requires ImageMagick to be installed.
window.save, 'filled_contour_plot_fg_fullsize.png'
Spawn, 'convert filled_contour_plot_fg_fullsize.png -resize 600 filled_contour_plot_fg_resized.png'
END
|
 comp.lang.idl-pvwave archive
 Members
 Search
 Help
Help Login
Login Home
Home


")
