| Slow object graphics when plotting multiple lines [message #92954] |
Fri, 01 April 2016 05:51  |
 steven.abel
Messages: 13
Registered: April 2016
|
Junior Member |
|
|
I am new to object graphics and struggling to speed up a simple plot that contains multiple lines.
Here is an example that plots 200 lines - the object graphics version is very slow compared to the direct graphics version.
;create some dummy data
x = replicate(0.,11,200)
y = x
FOR i=0,199 DO x[*,i] = FINDGEN(11)
FOR i=0,199 DO y[*,i] = RANDOMN(seed,11)
;plot in direct graphics
plot,[0,10],[-5,5],/nodata,yrange=[-5,5],ystyle=1
FOR i=0,199 DO oplot,x[*,i],y[*,i]
;plot in object graphics
w = window()
w.REFRESH, /DISABLE
p = plot([0,10],[-5,5],/nodata,yrange=[-5,5],/current)
FOR i=0,199 DO !NULL=plot(x[*,i],y[*,i],/overplot)
w.REFRESH
Is there any way to speed this up in object graphics?
Thanks
Steve
|
|
|
|
| Re: Slow object graphics when plotting multiple lines [message #92962 is a reply to message #92954] |
Mon, 04 April 2016 01:56  |
greg.addr
Messages: 160
Registered: May 2007
|
Senior Member |
|
|
On Friday, April 1, 2016 at 2:51:49 PM UTC+2, steve...@metoffice.gov.uk wrote:
> I am new to object graphics and struggling to speed up a simple plot that contains multiple lines.
>
> Here is an example that plots 200 lines - the object graphics version is very slow compared to the direct graphics version.
>
> ;create some dummy data
> x = replicate(0.,11,200)
> y = x
> FOR i=0,199 DO x[*,i] = FINDGEN(11)
> FOR i=0,199 DO y[*,i] = RANDOMN(seed,11)
>
> ;plot in direct graphics
> plot,[0,10],[-5,5],/nodata,yrange=[-5,5],ystyle=1
> FOR i=0,199 DO oplot,x[*,i],y[*,i]
>
> ;plot in object graphics
> w = window()
> w.REFRESH, /DISABLE
> p = plot([0,10],[-5,5],/nodata,yrange=[-5,5],/current)
> FOR i=0,199 DO !NULL=plot(x[*,i],y[*,i],/overplot)
> w.REFRESH
>
>
> Is there any way to speed this up in object graphics?
>
> Thanks
>
> Steve
You probably mean 'function graphics' - 'object graphics' is a different system. I think the extra time is the price you pay for being able to resize, zoom, rotate etc with your results.
I've been using a home-baked system for anti-aliasing direct graphics since before FG. It comes out intermediate between DG and FG:
pro test1
;create some dummy data
x = replicate(0.,11,200)
y = x
FOR i=0,199 DO x[*,i] = FINDGEN(11)
FOR i=0,199 DO y[*,i] = RANDOMN(seed,11)
;plot in direct graphics
tic
plot,[0,10],[-5,5],/nodata,yrange=[-5,5],ystyle=1
FOR i=0,199 DO oplot,x[*,i],y[*,i]
toc
;plot in object graphics
tic
w = window()
w.REFRESH, /DISABLE
p = plot([0,10],[-5,5],/nodata,yrange=[-5,5],/current)
FOR i=0,199 DO !NULL=plot(x[*,i],y[*,i],/overplot)
w.REFRESH
toc
;plot in gmwindow
tic
gmw=obj_new("gmwindow")
gmw->plot,[0,10],[-5,5],/nodata,yrange=[-5,5],ystyle=1
FOR i=0,199 DO gmw->oplot,x[*,i],y[*,i],/no_draw
gmw->draw
toc
end
IDL> test1
% Time elapsed: 0.094000101 seconds.
% Time elapsed: 3.6379998 seconds.
% Time elapsed: 0.68700004 seconds.
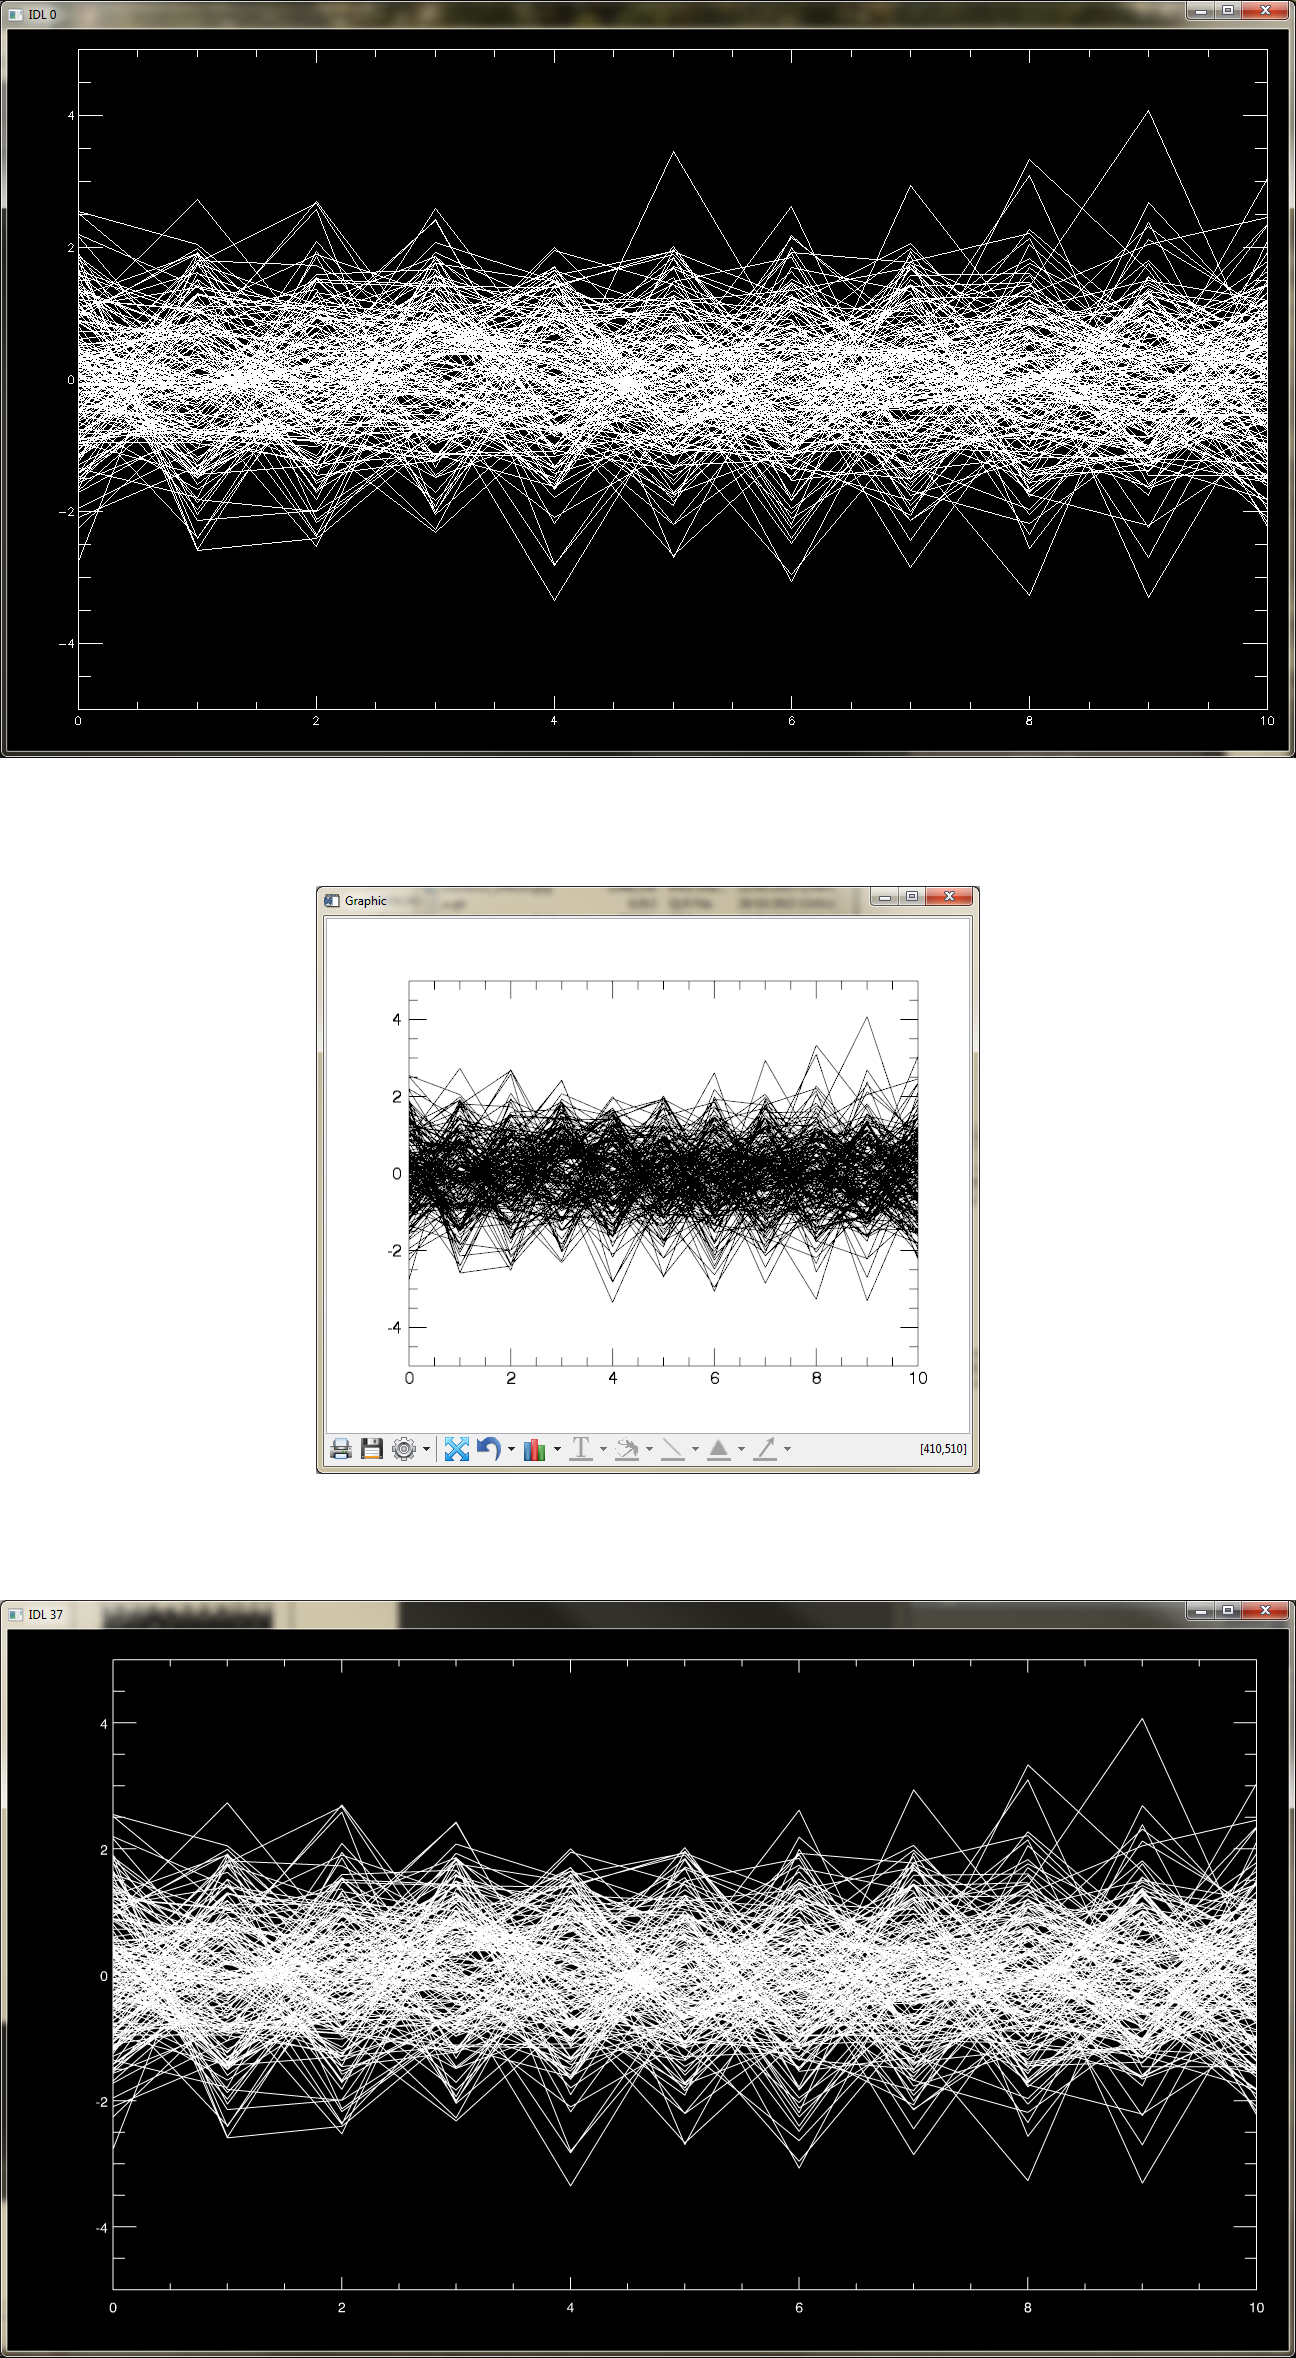
Output of all three are here: http://hrscview.fu-berlin.de/mex4/software/idl/gmwindow/dire ct_vs_function_vs_gmwindow.png
And the gmwindow code, here: http://hrscview.fu-berlin.de/mex4/software/idl/gmwindow/
cheers,
Greg
|
|
|
|
| Re: Slow object graphics when plotting multiple lines [message #92963 is a reply to message #92962] |
Mon, 04 April 2016 03:49 |
steven.abel
Messages: 13
Registered: April 2016
|
Junior Member |
|
|
On Monday, 4 April 2016 09:56:34 UTC+1, greg...@googlemail.com wrote:
> On Friday, April 1, 2016 at 2:51:49 PM UTC+2, steve...@metoffice.gov.uk wrote:
>> I am new to object graphics and struggling to speed up a simple plot that contains multiple lines.
>>
>> Here is an example that plots 200 lines - the object graphics version is very slow compared to the direct graphics version.
>>
>> ;create some dummy data
>> x = replicate(0.,11,200)
>> y = x
>> FOR i=0,199 DO x[*,i] = FINDGEN(11)
>> FOR i=0,199 DO y[*,i] = RANDOMN(seed,11)
>>
>> ;plot in direct graphics
>> plot,[0,10],[-5,5],/nodata,yrange=[-5,5],ystyle=1
>> FOR i=0,199 DO oplot,x[*,i],y[*,i]
>>
>> ;plot in object graphics
>> w = window()
>> w.REFRESH, /DISABLE
>> p = plot([0,10],[-5,5],/nodata,yrange=[-5,5],/current)
>> FOR i=0,199 DO !NULL=plot(x[*,i],y[*,i],/overplot)
>> w.REFRESH
>>
>>
>> Is there any way to speed this up in object graphics?
>>
>> Thanks
>>
>> Steve
>
> You probably mean 'function graphics' - 'object graphics' is a different system. I think the extra time is the price you pay for being able to resize, zoom, rotate etc with your results.
>
> I've been using a home-baked system for anti-aliasing direct graphics since before FG. It comes out intermediate between DG and FG:
>
> pro test1
> ;create some dummy data
> x = replicate(0.,11,200)
> y = x
> FOR i=0,199 DO x[*,i] = FINDGEN(11)
> FOR i=0,199 DO y[*,i] = RANDOMN(seed,11)
>
> ;plot in direct graphics
> tic
> plot,[0,10],[-5,5],/nodata,yrange=[-5,5],ystyle=1
> FOR i=0,199 DO oplot,x[*,i],y[*,i]
> toc
>
> ;plot in object graphics
> tic
> w = window()
> w.REFRESH, /DISABLE
> p = plot([0,10],[-5,5],/nodata,yrange=[-5,5],/current)
> FOR i=0,199 DO !NULL=plot(x[*,i],y[*,i],/overplot)
> w.REFRESH
> toc
>
> ;plot in gmwindow
> tic
> gmw=obj_new("gmwindow")
> gmw->plot,[0,10],[-5,5],/nodata,yrange=[-5,5],ystyle=1
> FOR i=0,199 DO gmw->oplot,x[*,i],y[*,i],/no_draw
> gmw->draw
> toc
>
> end
>
> IDL> test1
> % Time elapsed: 0.094000101 seconds.
> % Time elapsed: 3.6379998 seconds.
> % Time elapsed: 0.68700004 seconds.
>
> Output of all three are here: http://hrscview.fu-berlin.de/mex4/software/idl/gmwindow/dire ct_vs_function_vs_gmwindow.png
>
> And the gmwindow code, here: http://hrscview.fu-berlin.de/mex4/software/idl/gmwindow/
>
> cheers,
> Greg
Thanks Greg
Yes I did mean function graphics!
The actual plot I am doing has six figures in the same window (each panel contains about 200 lines) and it takes several minutes to render this using function graphics on my Linux machine. Looks like for this plot at least I will have to revert to direct graphics.
Cheers
Steve
|
|
|
|
| Re: Slow object graphics when plotting multiple lines [message #92964 is a reply to message #92963] |
Mon, 04 April 2016 04:12 |
lecacheux.alain
Messages: 325
Registered: January 2008
|
Senior Member |
|
|
Le lundi 4 avril 2016 12:49:33 UTC+2, steve...@metoffice.gov.uk a écrit :
> On Monday, 4 April 2016 09:56:34 UTC+1, greg...@googlemail.com wrote:
>> On Friday, April 1, 2016 at 2:51:49 PM UTC+2, steve...@metoffice.gov.uk wrote:
>>> I am new to object graphics and struggling to speed up a simple plot that contains multiple lines.
>>>
>>> Here is an example that plots 200 lines - the object graphics version is very slow compared to the direct graphics version.
>>>
>>> ;create some dummy data
>>> x = replicate(0.,11,200)
>>> y = x
>>> FOR i=0,199 DO x[*,i] = FINDGEN(11)
>>> FOR i=0,199 DO y[*,i] = RANDOMN(seed,11)
>>>
>>> ;plot in direct graphics
>>> plot,[0,10],[-5,5],/nodata,yrange=[-5,5],ystyle=1
>>> FOR i=0,199 DO oplot,x[*,i],y[*,i]
>>>
>>> ;plot in object graphics
>>> w = window()
>>> w.REFRESH, /DISABLE
>>> p = plot([0,10],[-5,5],/nodata,yrange=[-5,5],/current)
>>> FOR i=0,199 DO !NULL=plot(x[*,i],y[*,i],/overplot)
>>> w.REFRESH
>>>
>>>
>>> Is there any way to speed this up in object graphics?
>>>
>>> Thanks
>>>
>>> Steve
>>
>> You probably mean 'function graphics' - 'object graphics' is a different system. I think the extra time is the price you pay for being able to resize, zoom, rotate etc with your results.
>>
>> I've been using a home-baked system for anti-aliasing direct graphics since before FG. It comes out intermediate between DG and FG:
>>
>> pro test1
>> ;create some dummy data
>> x = replicate(0.,11,200)
>> y = x
>> FOR i=0,199 DO x[*,i] = FINDGEN(11)
>> FOR i=0,199 DO y[*,i] = RANDOMN(seed,11)
>>
>> ;plot in direct graphics
>> tic
>> plot,[0,10],[-5,5],/nodata,yrange=[-5,5],ystyle=1
>> FOR i=0,199 DO oplot,x[*,i],y[*,i]
>> toc
>>
>> ;plot in object graphics
>> tic
>> w = window()
>> w.REFRESH, /DISABLE
>> p = plot([0,10],[-5,5],/nodata,yrange=[-5,5],/current)
>> FOR i=0,199 DO !NULL=plot(x[*,i],y[*,i],/overplot)
>> w.REFRESH
>> toc
>>
>> ;plot in gmwindow
>> tic
>> gmw=obj_new("gmwindow")
>> gmw->plot,[0,10],[-5,5],/nodata,yrange=[-5,5],ystyle=1
>> FOR i=0,199 DO gmw->oplot,x[*,i],y[*,i],/no_draw
>> gmw->draw
>> toc
>>
>> end
>>
>> IDL> test1
>> % Time elapsed: 0.094000101 seconds.
>> % Time elapsed: 3.6379998 seconds.
>> % Time elapsed: 0.68700004 seconds.
>>
>> Output of all three are here: http://hrscview.fu-berlin.de/mex4/software/idl/gmwindow/dire ct_vs_function_vs_gmwindow.png
>>
>> And the gmwindow code, here: http://hrscview.fu-berlin.de/mex4/software/idl/gmwindow/
>>
>> cheers,
>> Greg
>
> Thanks Greg
>
> Yes I did mean function graphics!
>
> The actual plot I am doing has six figures in the same window (each panel contains about 200 lines) and it takes several minutes to render this using function graphics on my Linux machine. Looks like for this plot at least I will have to revert to direct graphics.
>
> Cheers
>
> Steve
The function PLOT(/OVERPLOT) does not work like the old OPLOT procedure: for each added new curve, the full environment of the already plotted graphics is recomputed and displayed (axis boundaries, etc...).
In your case, you might (should) instead use the POLYLINE or POLYGON functions whose speed is amazing.
alx.
|
|
|
|
| Re: Slow object graphics when plotting multiple lines [message #92965 is a reply to message #92964] |
Mon, 04 April 2016 04:39 |
steven.abel
Messages: 13
Registered: April 2016
|
Junior Member |
|
|
On Monday, 4 April 2016 12:12:21 UTC+1, alx wrote:
> Le lundi 4 avril 2016 12:49:33 UTC+2, steve...@metoffice.gov.uk a écrit :
>> On Monday, 4 April 2016 09:56:34 UTC+1, greg...@googlemail.com wrote:
>>> On Friday, April 1, 2016 at 2:51:49 PM UTC+2, steve...@metoffice.gov.uk wrote:
>>>> I am new to object graphics and struggling to speed up a simple plot that contains multiple lines.
>>>>
>>>> Here is an example that plots 200 lines - the object graphics version is very slow compared to the direct graphics version.
>>>>
>>>> ;create some dummy data
>>>> x = replicate(0.,11,200)
>>>> y = x
>>>> FOR i=0,199 DO x[*,i] = FINDGEN(11)
>>>> FOR i=0,199 DO y[*,i] = RANDOMN(seed,11)
>>>>
>>>> ;plot in direct graphics
>>>> plot,[0,10],[-5,5],/nodata,yrange=[-5,5],ystyle=1
>>>> FOR i=0,199 DO oplot,x[*,i],y[*,i]
>>>>
>>>> ;plot in object graphics
>>>> w = window()
>>>> w.REFRESH, /DISABLE
>>>> p = plot([0,10],[-5,5],/nodata,yrange=[-5,5],/current)
>>>> FOR i=0,199 DO !NULL=plot(x[*,i],y[*,i],/overplot)
>>>> w.REFRESH
>>>>
>>>>
>>>> Is there any way to speed this up in object graphics?
>>>>
>>>> Thanks
>>>>
>>>> Steve
>>>
>>> You probably mean 'function graphics' - 'object graphics' is a different system. I think the extra time is the price you pay for being able to resize, zoom, rotate etc with your results.
>>>
>>> I've been using a home-baked system for anti-aliasing direct graphics since before FG. It comes out intermediate between DG and FG:
>>>
>>> pro test1
>>> ;create some dummy data
>>> x = replicate(0.,11,200)
>>> y = x
>>> FOR i=0,199 DO x[*,i] = FINDGEN(11)
>>> FOR i=0,199 DO y[*,i] = RANDOMN(seed,11)
>>>
>>> ;plot in direct graphics
>>> tic
>>> plot,[0,10],[-5,5],/nodata,yrange=[-5,5],ystyle=1
>>> FOR i=0,199 DO oplot,x[*,i],y[*,i]
>>> toc
>>>
>>> ;plot in object graphics
>>> tic
>>> w = window()
>>> w.REFRESH, /DISABLE
>>> p = plot([0,10],[-5,5],/nodata,yrange=[-5,5],/current)
>>> FOR i=0,199 DO !NULL=plot(x[*,i],y[*,i],/overplot)
>>> w.REFRESH
>>> toc
>>>
>>> ;plot in gmwindow
>>> tic
>>> gmw=obj_new("gmwindow")
>>> gmw->plot,[0,10],[-5,5],/nodata,yrange=[-5,5],ystyle=1
>>> FOR i=0,199 DO gmw->oplot,x[*,i],y[*,i],/no_draw
>>> gmw->draw
>>> toc
>>>
>>> end
>>>
>>> IDL> test1
>>> % Time elapsed: 0.094000101 seconds.
>>> % Time elapsed: 3.6379998 seconds.
>>> % Time elapsed: 0.68700004 seconds.
>>>
>>> Output of all three are here: http://hrscview.fu-berlin.de/mex4/software/idl/gmwindow/dire ct_vs_function_vs_gmwindow.png
>>>
>>> And the gmwindow code, here: http://hrscview.fu-berlin.de/mex4/software/idl/gmwindow/
>>>
>>> cheers,
>>> Greg
>>
>> Thanks Greg
>>
>> Yes I did mean function graphics!
>>
>> The actual plot I am doing has six figures in the same window (each panel contains about 200 lines) and it takes several minutes to render this using function graphics on my Linux machine. Looks like for this plot at least I will have to revert to direct graphics.
>>
>> Cheers
>>
>> Steve
>
> The function PLOT(/OVERPLOT) does not work like the old OPLOT procedure: for each added new curve, the full environment of the already plotted graphics is recomputed and displayed (axis boundaries, etc...).
> In your case, you might (should) instead use the POLYLINE or POLYGON functions whose speed is amazing.
> alx.
Thanks for pointing me to polyline - that speeds up my test case by about a factor of 4 (still a lot slower than direct graphics)
PRO test
IRESOLVE
;create some dummy data
x = replicate(0.,11,200)
y = x
FOR i=0,199 DO x[*,i] = FINDGEN(11)
FOR i=0,199 DO y[*,i] = RANDOMN(seed,11)
;plot in direct graphics
st=SYSTIME(/SECONDS)
plot,[0,10],[-5,5],/nodata,yrange=[-5,5],ystyle=1
FOR i=0,199 DO oplot,x[*,i],y[*,i]
PRINT,SYSTIME(/SECONDS)-st
;plot in function graphics 1
st=SYSTIME(/SECONDS)
w = window()
w.REFRESH, /DISABLE
p = plot([0,10],[-5,5],/nodata,yrange=[-5,5],/current)
FOR i=0,199 DO !NULL=plot(x[*,i],y[*,i],/overplot)
w.REFRESH
PRINT,SYSTIME(/SECONDS)-st
;plot in function graphics 2
st=SYSTIME(/SECONDS)
w = window()
w.REFRESH, /DISABLE
p = plot([0,10],[-5,5],/nodata,yrange=[-5,5],/current)
FOR i=0,199 DO !NULL=polyline(x[*,i],y[*,i],/data)
w.REFRESH
PRINT,SYSTIME(/SECONDS)-st
END
Time taken for these 3 plots
IDL> print,!version
{ x86_64 linux unix linux 8.2 Apr 10 2012 64 64}
IDL> test
% Compiled module: $MAIN$.
0.0013258457
18.797473
4.7191000
|
|
|
|
| Re: Slow object graphics when plotting multiple lines [message #92966 is a reply to message #92965] |
Mon, 04 April 2016 05:19 |
lecacheux.alain
Messages: 325
Registered: January 2008
|
Senior Member |
|
|
Le lundi 4 avril 2016 13:39:41 UTC+2, steve...@metoffice.gov.uk a écrit :
> On Monday, 4 April 2016 12:12:21 UTC+1, alx wrote:
>> Le lundi 4 avril 2016 12:49:33 UTC+2, steve...@metoffice.gov.uk a écrit :
>>> On Monday, 4 April 2016 09:56:34 UTC+1, greg...@googlemail.com wrote:
>>>> On Friday, April 1, 2016 at 2:51:49 PM UTC+2, steve...@metoffice.gov.uk wrote:
>>>> > I am new to object graphics and struggling to speed up a simple plot that contains multiple lines.
>>>> >
>>>> > Here is an example that plots 200 lines - the object graphics version is very slow compared to the direct graphics version.
>>>> >
>>>> > ;create some dummy data
>>>> > x = replicate(0.,11,200)
>>>> > y = x
>>>> > FOR i=0,199 DO x[*,i] = FINDGEN(11)
>>>> > FOR i=0,199 DO y[*,i] = RANDOMN(seed,11)
>>>> >
>>>> > ;plot in direct graphics
>>>> > plot,[0,10],[-5,5],/nodata,yrange=[-5,5],ystyle=1
>>>> > FOR i=0,199 DO oplot,x[*,i],y[*,i]
>>>> >
>>>> > ;plot in object graphics
>>>> > w = window()
>>>> > w.REFRESH, /DISABLE
>>>> > p = plot([0,10],[-5,5],/nodata,yrange=[-5,5],/current)
>>>> > FOR i=0,199 DO !NULL=plot(x[*,i],y[*,i],/overplot)
>>>> > w.REFRESH
>>>> >
>>>> >
>>>> > Is there any way to speed this up in object graphics?
>>>> >
>>>> > Thanks
>>>> >
>>>> > Steve
>>>>
>>>> You probably mean 'function graphics' - 'object graphics' is a different system. I think the extra time is the price you pay for being able to resize, zoom, rotate etc with your results.
>>>>
>>>> I've been using a home-baked system for anti-aliasing direct graphics since before FG. It comes out intermediate between DG and FG:
>>>>
>>>> pro test1
>>>> ;create some dummy data
>>>> x = replicate(0.,11,200)
>>>> y = x
>>>> FOR i=0,199 DO x[*,i] = FINDGEN(11)
>>>> FOR i=0,199 DO y[*,i] = RANDOMN(seed,11)
>>>>
>>>> ;plot in direct graphics
>>>> tic
>>>> plot,[0,10],[-5,5],/nodata,yrange=[-5,5],ystyle=1
>>>> FOR i=0,199 DO oplot,x[*,i],y[*,i]
>>>> toc
>>>>
>>>> ;plot in object graphics
>>>> tic
>>>> w = window()
>>>> w.REFRESH, /DISABLE
>>>> p = plot([0,10],[-5,5],/nodata,yrange=[-5,5],/current)
>>>> FOR i=0,199 DO !NULL=plot(x[*,i],y[*,i],/overplot)
>>>> w.REFRESH
>>>> toc
>>>>
>>>> ;plot in gmwindow
>>>> tic
>>>> gmw=obj_new("gmwindow")
>>>> gmw->plot,[0,10],[-5,5],/nodata,yrange=[-5,5],ystyle=1
>>>> FOR i=0,199 DO gmw->oplot,x[*,i],y[*,i],/no_draw
>>>> gmw->draw
>>>> toc
>>>>
>>>> end
>>>>
>>>> IDL> test1
>>>> % Time elapsed: 0.094000101 seconds.
>>>> % Time elapsed: 3.6379998 seconds.
>>>> % Time elapsed: 0.68700004 seconds.
>>>>
>>>> Output of all three are here: http://hrscview.fu-berlin.de/mex4/software/idl/gmwindow/dire ct_vs_function_vs_gmwindow.png
>>>>
>>>> And the gmwindow code, here: http://hrscview.fu-berlin.de/mex4/software/idl/gmwindow/
>>>>
>>>> cheers,
>>>> Greg
>>>
>>> Thanks Greg
>>>
>>> Yes I did mean function graphics!
>>>
>>> The actual plot I am doing has six figures in the same window (each panel contains about 200 lines) and it takes several minutes to render this using function graphics on my Linux machine. Looks like for this plot at least I will have to revert to direct graphics.
>>>
>>> Cheers
>>>
>>> Steve
>>
>> The function PLOT(/OVERPLOT) does not work like the old OPLOT procedure: for each added new curve, the full environment of the already plotted graphics is recomputed and displayed (axis boundaries, etc...).
>> In your case, you might (should) instead use the POLYLINE or POLYGON functions whose speed is amazing.
>> alx.
>
> Thanks for pointing me to polyline - that speeds up my test case by about a factor of 4 (still a lot slower than direct graphics)
>
>
> PRO test
>
> IRESOLVE
>
> ;create some dummy data
> x = replicate(0.,11,200)
> y = x
> FOR i=0,199 DO x[*,i] = FINDGEN(11)
> FOR i=0,199 DO y[*,i] = RANDOMN(seed,11)
>
>
> ;plot in direct graphics
> st=SYSTIME(/SECONDS)
> plot,[0,10],[-5,5],/nodata,yrange=[-5,5],ystyle=1
> FOR i=0,199 DO oplot,x[*,i],y[*,i]
> PRINT,SYSTIME(/SECONDS)-st
>
> ;plot in function graphics 1
> st=SYSTIME(/SECONDS)
> w = window()
> w.REFRESH, /DISABLE
> p = plot([0,10],[-5,5],/nodata,yrange=[-5,5],/current)
> FOR i=0,199 DO !NULL=plot(x[*,i],y[*,i],/overplot)
> w.REFRESH
> PRINT,SYSTIME(/SECONDS)-st
>
> ;plot in function graphics 2
> st=SYSTIME(/SECONDS)
> w = window()
> w.REFRESH, /DISABLE
> p = plot([0,10],[-5,5],/nodata,yrange=[-5,5],/current)
> FOR i=0,199 DO !NULL=polyline(x[*,i],y[*,i],/data)
> w.REFRESH
> PRINT,SYSTIME(/SECONDS)-st
>
> END
>
> Time taken for these 3 plots
>
> IDL> print,!version
> { x86_64 linux unix linux 8.2 Apr 10 2012 64 64}
> IDL> test
> % Compiled module: $MAIN$.
> 0.0013258457
> 18.797473
> 4.7191000
You might call POLYLINE only once by using the CONNECTIVITY keyword (i.e. by building a single *poly*line from your 200 initial lines). This should make everything even faster.
alx.
|
|
|
|
| Re: Slow object graphics when plotting multiple lines [message #92967 is a reply to message #92966] |
Mon, 04 April 2016 07:20 |
steven.abel
Messages: 13
Registered: April 2016
|
Junior Member |
|
|
On Monday, 4 April 2016 13:19:23 UTC+1, alx wrote:
> Le lundi 4 avril 2016 13:39:41 UTC+2, steve...@metoffice.gov.uk a écrit :
>> On Monday, 4 April 2016 12:12:21 UTC+1, alx wrote:
>>> Le lundi 4 avril 2016 12:49:33 UTC+2, steve...@metoffice.gov.uk a écrit :
>>>> On Monday, 4 April 2016 09:56:34 UTC+1, greg...@googlemail.com wrote:
>>>> > On Friday, April 1, 2016 at 2:51:49 PM UTC+2, steve...@metoffice.gov.uk wrote:
>>>> > > I am new to object graphics and struggling to speed up a simple plot that contains multiple lines.
>>>> > >
>>>> > > Here is an example that plots 200 lines - the object graphics version is very slow compared to the direct graphics version.
>>>> > >
>>>> > > ;create some dummy data
>>>> > > x = replicate(0.,11,200)
>>>> > > y = x
>>>> > > FOR i=0,199 DO x[*,i] = FINDGEN(11)
>>>> > > FOR i=0,199 DO y[*,i] = RANDOMN(seed,11)
>>>> > >
>>>> > > ;plot in direct graphics
>>>> > > plot,[0,10],[-5,5],/nodata,yrange=[-5,5],ystyle=1
>>>> > > FOR i=0,199 DO oplot,x[*,i],y[*,i]
>>>> > >
>>>> > > ;plot in object graphics
>>>> > > w = window()
>>>> > > w.REFRESH, /DISABLE
>>>> > > p = plot([0,10],[-5,5],/nodata,yrange=[-5,5],/current)
>>>> > > FOR i=0,199 DO !NULL=plot(x[*,i],y[*,i],/overplot)
>>>> > > w.REFRESH
>>>> > >
>>>> > >
>>>> > > Is there any way to speed this up in object graphics?
>>>> > >
>>>> > > Thanks
>>>> > >
>>>> > > Steve
>>>> >
>>>> > You probably mean 'function graphics' - 'object graphics' is a different system. I think the extra time is the price you pay for being able to resize, zoom, rotate etc with your results.
>>>> >
>>>> > I've been using a home-baked system for anti-aliasing direct graphics since before FG. It comes out intermediate between DG and FG:
>>>> >
>>>> > pro test1
>>>> > ;create some dummy data
>>>> > x = replicate(0.,11,200)
>>>> > y = x
>>>> > FOR i=0,199 DO x[*,i] = FINDGEN(11)
>>>> > FOR i=0,199 DO y[*,i] = RANDOMN(seed,11)
>>>> >
>>>> > ;plot in direct graphics
>>>> > tic
>>>> > plot,[0,10],[-5,5],/nodata,yrange=[-5,5],ystyle=1
>>>> > FOR i=0,199 DO oplot,x[*,i],y[*,i]
>>>> > toc
>>>> >
>>>> > ;plot in object graphics
>>>> > tic
>>>> > w = window()
>>>> > w.REFRESH, /DISABLE
>>>> > p = plot([0,10],[-5,5],/nodata,yrange=[-5,5],/current)
>>>> > FOR i=0,199 DO !NULL=plot(x[*,i],y[*,i],/overplot)
>>>> > w.REFRESH
>>>> > toc
>>>> >
>>>> > ;plot in gmwindow
>>>> > tic
>>>> > gmw=obj_new("gmwindow")
>>>> > gmw->plot,[0,10],[-5,5],/nodata,yrange=[-5,5],ystyle=1
>>>> > FOR i=0,199 DO gmw->oplot,x[*,i],y[*,i],/no_draw
>>>> > gmw->draw
>>>> > toc
>>>> >
>>>> > end
>>>> >
>>>> > IDL> test1
>>>> > % Time elapsed: 0.094000101 seconds.
>>>> > % Time elapsed: 3.6379998 seconds.
>>>> > % Time elapsed: 0.68700004 seconds.
>>>> >
>>>> > Output of all three are here: http://hrscview.fu-berlin.de/mex4/software/idl/gmwindow/dire ct_vs_function_vs_gmwindow.png
>>>> >
>>>> > And the gmwindow code, here: http://hrscview.fu-berlin.de/mex4/software/idl/gmwindow/
>>>> >
>>>> > cheers,
>>>> > Greg
>>>>
>>>> Thanks Greg
>>>>
>>>> Yes I did mean function graphics!
>>>>
>>>> The actual plot I am doing has six figures in the same window (each panel contains about 200 lines) and it takes several minutes to render this using function graphics on my Linux machine. Looks like for this plot at least I will have to revert to direct graphics.
>>>>
>>>> Cheers
>>>>
>>>> Steve
>>>
>>> The function PLOT(/OVERPLOT) does not work like the old OPLOT procedure: for each added new curve, the full environment of the already plotted graphics is recomputed and displayed (axis boundaries, etc...).
>>> In your case, you might (should) instead use the POLYLINE or POLYGON functions whose speed is amazing.
>>> alx.
>>
>> Thanks for pointing me to polyline - that speeds up my test case by about a factor of 4 (still a lot slower than direct graphics)
>>
>>
>> PRO test
>>
>> IRESOLVE
>>
>> ;create some dummy data
>> x = replicate(0.,11,200)
>> y = x
>> FOR i=0,199 DO x[*,i] = FINDGEN(11)
>> FOR i=0,199 DO y[*,i] = RANDOMN(seed,11)
>>
>>
>> ;plot in direct graphics
>> st=SYSTIME(/SECONDS)
>> plot,[0,10],[-5,5],/nodata,yrange=[-5,5],ystyle=1
>> FOR i=0,199 DO oplot,x[*,i],y[*,i]
>> PRINT,SYSTIME(/SECONDS)-st
>>
>> ;plot in function graphics 1
>> st=SYSTIME(/SECONDS)
>> w = window()
>> w.REFRESH, /DISABLE
>> p = plot([0,10],[-5,5],/nodata,yrange=[-5,5],/current)
>> FOR i=0,199 DO !NULL=plot(x[*,i],y[*,i],/overplot)
>> w.REFRESH
>> PRINT,SYSTIME(/SECONDS)-st
>>
>> ;plot in function graphics 2
>> st=SYSTIME(/SECONDS)
>> w = window()
>> w.REFRESH, /DISABLE
>> p = plot([0,10],[-5,5],/nodata,yrange=[-5,5],/current)
>> FOR i=0,199 DO !NULL=polyline(x[*,i],y[*,i],/data)
>> w.REFRESH
>> PRINT,SYSTIME(/SECONDS)-st
>>
>> END
>>
>> Time taken for these 3 plots
>>
>> IDL> print,!version
>> { x86_64 linux unix linux 8.2 Apr 10 2012 64 64}
>> IDL> test
>> % Compiled module: $MAIN$.
>> 0.0013258457
>> 18.797473
>> 4.7191000
>
> You might call POLYLINE only once by using the CONNECTIVITY keyword (i.e. by building a single *poly*line from your 200 initial lines). This should make everything even faster.
> alx.
Thanks for pointing me to that - took me a little while for me to understand the IDL documentation!
Using the connectivity keyword as below speeded it up significantly, with the test plot taking only 0.38 seconds on my machine. A big improvement on my initial implementation in function graphics!
xx=REFORM(x,n_elements(x))
yy=REFORM(y,n_elements(y))
conn = LONARR(n_elements(xx)+200)
FOR i = 0, 2400-1, 12 DO conn[i]=11
FOR i = 1, 2400-1, 12 DO conn[i:i+10]=LINDGEN(11)+i-FLOOR(i/12.)-1
;plot in function graphics 3
w = window()
w.REFRESH, /DISABLE
p = plot([0,10],[-5,5],/nodata,yrange=[-5,5],/current)
!NULL=polyline(xx,yy,connectivity=conn,/data,target=p)
w.REFRESH
Cheers
Ste
|
|
|
|
| Re: Slow object graphics when plotting multiple lines [message #92968 is a reply to message #92967] |
Mon, 04 April 2016 07:48 |
Yngvar Larsen
Messages: 134
Registered: January 2010
|
Senior Member |
|
|
Another trick, using a single array with lines separated by NaN. This works both in direct and function graphics. With these two added, plus the new CONNECTIVITY trick, your TEST routine prints this on my machine (2012 iMac)
;; your original routines
0.0013830662
3.0384021
2.2408111
;; new routines
0.26107001 ; Function graphics, NaN
0.0011150837 ; Direct graphics, NaN (scales much better than looping over PLOT, ...)
;; The CONNECTIVITY trick:
0.26308203
For 2000 lines, skipping your first two function graphics attempts that use minutes...
0.040501118 ; loop, direct graphics
0.28132486 ; NaN, function graphics
0.011729956 ; NaN, direct graphics
0.32190108 ; CONNECTIVITY, function graphics
For 20000 lines:
1.6218228
0.39294910
0.10883307
0.37250996
For 200000 lines:
17.753630
1.3837330
1.0937860
1.3553588
Direct graphics with NaN is the winner, but function graphics is not far behind. Basically, it seems the difference is constant, likely this is mostly the overhead of creating the graphics window.
;;;; NEW CODE BELOW HERE ;;;;;;;;
;plot in function graphics 3
st=SYSTIME(/SECONDS)
xx = [x, replicate(!values.f_nan, 1,200)]
yy = [y, replicate(!values.f_nan, 1,200)]
w = window()
w.REFRESH, /DISABLE
p = plot(xx, yy, /current)
w.REFRESH
PRINT,SYSTIME(/SECONDS)-st
;plot in direct graphics
st=SYSTIME(/SECONDS)
plot,xx,yy,/nodata,yrange=[-5,5],ystyle=1, /xstyle
PRINT,SYSTIME(/SECONDS)-st
On Monday, 4 April 2016 16:20:51 UTC+2, steve...@metoffice.gov.uk wrote:
> On Monday, 4 April 2016 13:19:23 UTC+1, alx wrote:
>> Le lundi 4 avril 2016 13:39:41 UTC+2, steve...@metoffice.gov.uk a écrit :
>>> On Monday, 4 April 2016 12:12:21 UTC+1, alx wrote:
>>>> Le lundi 4 avril 2016 12:49:33 UTC+2, steve...@metoffice.gov.uk a écrit :
>>>> > On Monday, 4 April 2016 09:56:34 UTC+1, greg...@googlemail.com wrote:
>>>> > > On Friday, April 1, 2016 at 2:51:49 PM UTC+2, steve...@metoffice.gov.uk wrote:
>>>> > > > I am new to object graphics and struggling to speed up a simple plot that contains multiple lines.
>>>> > > >
>>>> > > > Here is an example that plots 200 lines - the object graphics version is very slow compared to the direct graphics version.
>>>> > > >
>>>> > > > ;create some dummy data
>>>> > > > x = replicate(0.,11,200)
>>>> > > > y = x
>>>> > > > FOR i=0,199 DO x[*,i] = FINDGEN(11)
>>>> > > > FOR i=0,199 DO y[*,i] = RANDOMN(seed,11)
>>>> > > >
>>>> > > > ;plot in direct graphics
>>>> > > > plot,[0,10],[-5,5],/nodata,yrange=[-5,5],ystyle=1
>>>> > > > FOR i=0,199 DO oplot,x[*,i],y[*,i]
>>>> > > >
>>>> > > > ;plot in object graphics
>>>> > > > w = window()
>>>> > > > w.REFRESH, /DISABLE
>>>> > > > p = plot([0,10],[-5,5],/nodata,yrange=[-5,5],/current)
>>>> > > > FOR i=0,199 DO !NULL=plot(x[*,i],y[*,i],/overplot)
>>>> > > > w.REFRESH
>>>> > > >
>>>> > > >
>>>> > > > Is there any way to speed this up in object graphics?
>>>> > > >
>>>> > > > Thanks
>>>> > > >
>>>> > > > Steve
>>>> > >
>>>> > > You probably mean 'function graphics' - 'object graphics' is a different system. I think the extra time is the price you pay for being able to resize, zoom, rotate etc with your results.
>>>> > >
>>>> > > I've been using a home-baked system for anti-aliasing direct graphics since before FG. It comes out intermediate between DG and FG:
>>>> > >
>>>> > > pro test1
>>>> > > ;create some dummy data
>>>> > > x = replicate(0.,11,200)
>>>> > > y = x
>>>> > > FOR i=0,199 DO x[*,i] = FINDGEN(11)
>>>> > > FOR i=0,199 DO y[*,i] = RANDOMN(seed,11)
>>>> > >
>>>> > > ;plot in direct graphics
>>>> > > tic
>>>> > > plot,[0,10],[-5,5],/nodata,yrange=[-5,5],ystyle=1
>>>> > > FOR i=0,199 DO oplot,x[*,i],y[*,i]
>>>> > > toc
>>>> > >
>>>> > > ;plot in object graphics
>>>> > > tic
>>>> > > w = window()
>>>> > > w.REFRESH, /DISABLE
>>>> > > p = plot([0,10],[-5,5],/nodata,yrange=[-5,5],/current)
>>>> > > FOR i=0,199 DO !NULL=plot(x[*,i],y[*,i],/overplot)
>>>> > > w.REFRESH
>>>> > > toc
>>>> > >
>>>> > > ;plot in gmwindow
>>>> > > tic
>>>> > > gmw=obj_new("gmwindow")
>>>> > > gmw->plot,[0,10],[-5,5],/nodata,yrange=[-5,5],ystyle=1
>>>> > > FOR i=0,199 DO gmw->oplot,x[*,i],y[*,i],/no_draw
>>>> > > gmw->draw
>>>> > > toc
>>>> > >
>>>> > > end
>>>> > >
>>>> > > IDL> test1
>>>> > > % Time elapsed: 0.094000101 seconds.
>>>> > > % Time elapsed: 3.6379998 seconds.
>>>> > > % Time elapsed: 0.68700004 seconds.
>>>> > >
>>>> > > Output of all three are here: http://hrscview.fu-berlin.de/mex4/software/idl/gmwindow/dire ct_vs_function_vs_gmwindow.png
>>>> > >
>>>> > > And the gmwindow code, here: http://hrscview.fu-berlin.de/mex4/software/idl/gmwindow/
>>>> > >
>>>> > > cheers,
>>>> > > Greg
>>>> >
>>>> > Thanks Greg
>>>> >
>>>> > Yes I did mean function graphics!
>>>> >
>>>> > The actual plot I am doing has six figures in the same window (each panel contains about 200 lines) and it takes several minutes to render this using function graphics on my Linux machine. Looks like for this plot at least I will have to revert to direct graphics.
>>>> >
>>>> > Cheers
>>>> >
>>>> > Steve
>>>>
>>>> The function PLOT(/OVERPLOT) does not work like the old OPLOT procedure: for each added new curve, the full environment of the already plotted graphics is recomputed and displayed (axis boundaries, etc...).
>>>> In your case, you might (should) instead use the POLYLINE or POLYGON functions whose speed is amazing.
>>>> alx.
>>>
>>> Thanks for pointing me to polyline - that speeds up my test case by about a factor of 4 (still a lot slower than direct graphics)
>>>
>>>
>>> PRO test
>>>
>>> IRESOLVE
>>>
>>> ;create some dummy data
>>> x = replicate(0.,11,200)
>>> y = x
>>> FOR i=0,199 DO x[*,i] = FINDGEN(11)
>>> FOR i=0,199 DO y[*,i] = RANDOMN(seed,11)
>>>
>>>
>>> ;plot in direct graphics
>>> st=SYSTIME(/SECONDS)
>>> plot,[0,10],[-5,5],/nodata,yrange=[-5,5],ystyle=1
>>> FOR i=0,199 DO oplot,x[*,i],y[*,i]
>>> PRINT,SYSTIME(/SECONDS)-st
>>>
>>> ;plot in function graphics 1
>>> st=SYSTIME(/SECONDS)
>>> w = window()
>>> w.REFRESH, /DISABLE
>>> p = plot([0,10],[-5,5],/nodata,yrange=[-5,5],/current)
>>> FOR i=0,199 DO !NULL=plot(x[*,i],y[*,i],/overplot)
>>> w.REFRESH
>>> PRINT,SYSTIME(/SECONDS)-st
>>>
>>> ;plot in function graphics 2
>>> st=SYSTIME(/SECONDS)
>>> w = window()
>>> w.REFRESH, /DISABLE
>>> p = plot([0,10],[-5,5],/nodata,yrange=[-5,5],/current)
>>> FOR i=0,199 DO !NULL=polyline(x[*,i],y[*,i],/data)
>>> w.REFRESH
>>> PRINT,SYSTIME(/SECONDS)-st
>>>
>>> END
>>>
>>> Time taken for these 3 plots
>>>
>>> IDL> print,!version
>>> { x86_64 linux unix linux 8.2 Apr 10 2012 64 64}
>>> IDL> test
>>> % Compiled module: $MAIN$.
>>> 0.0013258457
>>> 18.797473
>>> 4.7191000
>>
>> You might call POLYLINE only once by using the CONNECTIVITY keyword (i.e. by building a single *poly*line from your 200 initial lines). This should make everything even faster.
>> alx.
>
> Thanks for pointing me to that - took me a little while for me to understand the IDL documentation!
>
> Using the connectivity keyword as below speeded it up significantly, with the test plot taking only 0.38 seconds on my machine. A big improvement on my initial implementation in function graphics!
>
> xx=REFORM(x,n_elements(x))
> yy=REFORM(y,n_elements(y))
> conn = LONARR(n_elements(xx)+200)
> FOR i = 0, 2400-1, 12 DO conn[i]=11
> FOR i = 1, 2400-1, 12 DO conn[i:i+10]=LINDGEN(11)+i-FLOOR(i/12.)-1
> ;plot in function graphics 3
> w = window()
> w.REFRESH, /DISABLE
> p = plot([0,10],[-5,5],/nodata,yrange=[-5,5],/current)
> !NULL=polyline(xx,yy,connectivity=conn,/data,target=p)
> w.REFRESH
>
>
> Cheers
>
> Ste
|
|
|
|
| Re: Slow object graphics when plotting multiple lines [message #92971 is a reply to message #92968] |
Mon, 04 April 2016 08:09 |
Paul Van Delst[1]
Messages: 1157
Registered: April 2002
|
Senior Member |
|
|
Hello,
On 04/04/16 10:48, Yngvar Larsen wrote:
> Another trick, using a single array with lines separated by NaN.
> Thisworks both in direct and function graphics. With these two added, plus
> the new CONNECTIVITY trick, your TEST routine prints this on my machine
> (2012 iMac)
I'm amazed at everyone's ability to discover these things! Wow.
But, I think this need for various "tricks" to speed up basic plotting
functionality is something that the IDL/Harris folks need to fix by
making PLOT(/OVERPLOT) - with additional keywords if necessary - work
similarly, i.e. fast.
Similarly when plotting gobs of satellite data on maps, surfaces,
contours, etc.
The slowness of function graphics when plotting lots and lots of data
makes it unusable for looking at large datasets.
Other, similar, tools don't have these issues. (Yes, I mean matlab).
cheers,
paulv
|
|
|
|
| Re: Slow object graphics when plotting multiple lines [message #92972 is a reply to message #92971] |
Mon, 04 April 2016 08:27 |
steven.abel
Messages: 13
Registered: April 2016
|
Junior Member |
|
|
On Monday, 4 April 2016 16:09:36 UTC+1, Paul van Delst wrote:
> Hello,
>
> On 04/04/16 10:48, Yngvar Larsen wrote:
>> Another trick, using a single array with lines separated by NaN.
>> Thisworks both in direct and function graphics. With these two added, plus
>> the new CONNECTIVITY trick, your TEST routine prints this on my machine
>> (2012 iMac)
>
> I'm amazed at everyone's ability to discover these things! Wow.
>
> But, I think this need for various "tricks" to speed up basic plotting
> functionality is something that the IDL/Harris folks need to fix by
> making PLOT(/OVERPLOT) - with additional keywords if necessary - work
> similarly, i.e. fast.
>
> Similarly when plotting gobs of satellite data on maps, surfaces,
> contours, etc.
>
> The slowness of function graphics when plotting lots and lots of data
> makes it unusable for looking at large datasets.
>
> Other, similar, tools don't have these issues. (Yes, I mean matlab).
>
> cheers,
>
> paulv
Thank you alx and Yngvar - your suggestions have helped enormously. It is fair to say that without this newsgroup I would have given up and gone back to Direct graphics for this task. Completely agree with Paul as well - it shouldn't be this complicated to do a simple plot.
Cheers
Steve
|
|
|
|
| Re: Slow object graphics when plotting multiple lines [message #92973 is a reply to message #92971] |
Mon, 04 April 2016 08:54 |
lecacheux.alain
Messages: 325
Registered: January 2008
|
Senior Member |
|
|
Le lundi 4 avril 2016 17:09:36 UTC+2, Paul van Delst a écrit :
> Hello,
>
> On 04/04/16 10:48, Yngvar Larsen wrote:
>> Another trick, using a single array with lines separated by NaN.
>> Thisworks both in direct and function graphics. With these two added, plus
>> the new CONNECTIVITY trick, your TEST routine prints this on my machine
>> (2012 iMac)
>
> I'm amazed at everyone's ability to discover these things! Wow.
>
> But, I think this need for various "tricks" to speed up basic plotting
> functionality is something that the IDL/Harris folks need to fix by
> making PLOT(/OVERPLOT) - with additional keywords if necessary - work
> similarly, i.e. fast.
>
> Similarly when plotting gobs of satellite data on maps, surfaces,
> contours, etc.
>
> The slowness of function graphics when plotting lots and lots of data
> makes it unusable for looking at large datasets.
>
> Other, similar, tools don't have these issues. (Yes, I mean matlab).
>
> cheers,
>
> paulv
As far as I understand, the function PLOT(/OVERPLOT) was NOT designed as being a simple overplotting routine. When you add a new curve, the entire plot is actually modified (ranges, axes, etc...) at the expense of some slowness. I guess that it is a feature from Exelis.
If you want to do a "simple" overplotting (ala OPLOT), an efficient way is to combine POSITION, CURRENT and [XYZ]RANGE keywords, instead of using OVERPLOT.
The POLYLINE trick, when many curves are needed, looks like to me somewhat faster than Matlab or Python equivalents.
alx.
alx.
|
|
|
|
| Re: Slow object graphics when plotting multiple lines [message #92974 is a reply to message #92973] |
Mon, 04 April 2016 09:50 |
Yngvar Larsen
Messages: 134
Registered: January 2010
|
Senior Member |
|
|
On Monday, 4 April 2016 17:54:03 UTC+2, alx wrote:
>> Other, similar, tools don't have these issues. (Yes, I mean matlab).
> As far as I understand, the function PLOT(/OVERPLOT) was NOT designed as being a simple overplotting routine. When you add a new curve, the entire plot is actually modified (ranges, axes, etc...) at the expense of some slowness. I guess that it is a feature from Exelis.
Yes, this "feature" makes this approach O(N^2), which scales terribly beyond a couple of hundred lines. I don't see why the view needs to be recalculated for each new object, at least not by default.
Though this use is not really what you should do in IDL anyway since the overhead created by the loop itself makes even direct graphics slow when then number of lines becomes large (> 10000 or so).
> If you want to do a "simple" overplotting (ala OPLOT), an efficient way is to combine POSITION, CURRENT and [XYZ]RANGE keywords, instead of using OVERPLOT.
How? The documentation of PLOT() indicates something else (unless I misunderstood you):
******************
OVERPLOT
Set this keyword to 1 (one) to place the graphic on top of the currently-selected graphic within the current window. The two graphics items will then share the same set of axes. If no current window exists, then this keyword is ignored and a new window is created.
[...]
Tip: If you want your graphic to have a new set of axes, you should use the CURRENT keyword instead.
CURRENT
Set this keyword to create the graphic in the current window with a new set of axes. If no window exists, a new window is created.
[...]
Tip: If you want your graphic to share the same axes as an existing graphic, you should use the OVERPLOT keyword instead.
******************
I think it should be possible to do something like
p = PLOT(randn(seed,num_ points, num_lines))
and get what you want without jumping through the hoops involved in constructing the CONNECTIVITY matrix or adding fake missing data (NaN) to make it work. I don't see why not. PLOT() currently takes a vector as input, and if you try to apply it to a 2D array, it will flatten to a 1D array first. The latter property is _not_ documented, so the Harris people could easily add this functionality. It should be <10 lines of code. It would make the life easier for simple cases like this where all the curves have the same number of points.
> The POLYLINE trick, when many curves are needed, looks like to me somewhat faster than Matlab or Python equivalents.
Indeed. And, as I showed, nearly as fast as direct graphics for large number of lines. Which is quite impressive!
POLYLINE is of course still very useful when plotting lots of curves with different number of points, e.g. a map.
--
Yngvar
|
|
|
|
| Re: Slow object graphics when plotting multiple lines [message #92975 is a reply to message #92974] |
Mon, 04 April 2016 10:15 |
lecacheux.alain
Messages: 325
Registered: January 2008
|
Senior Member |
|
|
Le lundi 4 avril 2016 18:51:01 UTC+2, Yngvar Larsen a écrit :
> On Monday, 4 April 2016 17:54:03 UTC+2, alx wrote:
>
>>> Other, similar, tools don't have these issues. (Yes, I mean matlab).
>
>> As far as I understand, the function PLOT(/OVERPLOT) was NOT designed as being a simple overplotting routine. When you add a new curve, the entire plot is actually modified (ranges, axes, etc...) at the expense of some slowness. I guess that it is a feature from Exelis.
>
> Yes, this "feature" makes this approach O(N^2), which scales terribly beyond a couple of hundred lines. I don't see why the view needs to be recalculated for each new object, at least not by default.
>
> Though this use is not really what you should do in IDL anyway since the overhead created by the loop itself makes even direct graphics slow when then number of lines becomes large (> 10000 or so).
>
>> If you want to do a "simple" overplotting (ala OPLOT), an efficient way is to combine POSITION, CURRENT and [XYZ]RANGE keywords, instead of using OVERPLOT.
>
> How? The documentation of PLOT() indicates something else (unless I misunderstood you):
>
> ******************
> OVERPLOT
> Set this keyword to 1 (one) to place the graphic on top of the currently-selected graphic within the current window. The two graphics items will then share the same set of axes. If no current window exists, then this keyword is ignored and a new window is created.
> [...]
> Tip: If you want your graphic to have a new set of axes, you should use the CURRENT keyword instead.
>
> CURRENT
> Set this keyword to create the graphic in the current window with a new set of axes. If no window exists, a new window is created.
> [...]
> Tip: If you want your graphic to share the same axes as an existing graphic, you should use the OVERPLOT keyword instead.
> ******************
>
> I think it should be possible to do something like
>
> p = PLOT(randn(seed,num_ points, num_lines))
>
> and get what you want without jumping through the hoops involved in constructing the CONNECTIVITY matrix or adding fake missing data (NaN) to make it work. I don't see why not. PLOT() currently takes a vector as input, and if you try to apply it to a 2D array, it will flatten to a 1D array first. The latter property is _not_ documented, so the Harris people could easily add this functionality. It should be <10 lines of code. It would make the life easier for simple cases like this where all the curves have the same number of points.
>
>> The POLYLINE trick, when many curves are needed, looks like to me somewhat faster than Matlab or Python equivalents.
>
> Indeed. And, as I showed, nearly as fast as direct graphics for large number of lines. Which is quite impressive!
>
> POLYLINE is of course still very useful when plotting lots of curves with different number of points, e.g. a map.
>
> --
> Yngvar
> How? The documentation of PLOT() indicates something else (unless I misunderstood you):
IDL> pl = plot(/TEST)
IDL> pl1 = plot([50,100], [-0.5,0.5], COLOR='red', /CURRENT, POSITION=pl.POSITION, XRANGE=pl.XRANGE, YRANGE=pl.YRANGE)
|
|
|
|
| Re: Slow object graphics when plotting multiple lines [message #92979 is a reply to message #92975] |
Mon, 04 April 2016 13:10 |
Yngvar Larsen
Messages: 134
Registered: January 2010
|
Senior Member |
|
|
On Monday, 4 April 2016 19:15:11 UTC+2, alx wrote:
> Le lundi 4 avril 2016 18:51:01 UTC+2, Yngvar Larsen a écrit :
>> How? The documentation of PLOT() indicates something else (unless I misunderstood you):
> IDL> pl = plot(/TEST)
> IDL> pl1 = plot([50,100], [-0.5,0.5], COLOR='red', /CURRENT, POSITION=pl.POSITION, XRANGE=pl.XRANGE, YRANGE=pl.YRANGE)
Thanks. Interesting. This seems to do exactly what the documentation says /OVERPLOT should do, by faking a shared axis? (typical direct graphics trick!) And completely contrary to the tip I cited from the /CURRENT docs:
"Tip: If you want your graphic to share the same axes as an existing graphic, you should use the OVERPLOT keyword instead. "
Also, at least on my machine, /CURRENT is 4x slower than the /OVERPLOT in OP's loop case, even with hardcoded range/position according to your suggestion. Strange.
--
Yngvar
|
|
|
|
 comp.lang.idl-pvwave archive
 Members
 Search
 Help
Help Login
Login Home
Home


")
