Well, you could try something like this (and assuming result1, result2 are supposed to be the same size and not different like in your code):
missingval=0 ; or whatever indicates no data
nx=n_elements(result1[*,0]) ; get size of x dimension
ny=n_elements(result1[0,*]) ; get size of y dimension
result_averaged=fltarr(36,400) ; array to contain average results
for i=0l,nx-1 do begin
for j=0l,ny-1 do begin ; Loop over cells
if result1[i,j] eq missingval and result2[i,j] eq missingval then result_averaged[i,j] = missingval
if result1[i,j] eq missingval and result2[i,j] ne missingval then result_averaged[i,j] = result2[i,j]
if result1[i,j] ne missingval and result2[i,j] eq missingval then result_averaged[i,j] = result1[i,j]
if result1[i,j] ne missingval and result2[i,j] ne missingval then result_averaged[i,j] = mean([result1[i,j],result2[i,j]])
endfor
endfor
Then do your plotting using result_averaged.
There are probably more efficient ways to code this but I think the above is an easy-to-understand method, if I have understood your problem correctly. Hope this helps!
Andy
On Wednesday, February 12, 2014 12:14:21 PM UTC-5, Chase Calkins wrote:
> Hello Everyone,
>
>
>
> I have a couple of files that I overlap on a mapset but when I plot it, the image is overwritten by the latter of each file. A simple set up is essentially like this.
>
>
>
> Lat1 = fltarr[36,400]
>
> Lon1 = fltarr[36,400]
>
>
>
> Lat2 = fltarr[36,400]
>
> Lon2 = fltarr[36,400]
>
>
>
> result1 = fltarr[36,400]
>
> result2 = fltarr[46,400]
>
>
>
> cgcontour, result1, Lon1, Lat1, level = findgen(18)/10-.2, /overplot, /cell_fill
>
>
>
> MAP_SET, /Continents, limit = [10,70,45,135], /grid, label = 2, latlab = 110, color =1, charsize = 1.9, /noerase
>
>
>
> cgcontour, result2, Lon2, Lat2, level = findgen(18)/10-.2, /overplot, /cell_fill
>
>
>
> MAP_SET, /Continents, limit = [10,70,45,135], /grid, label = 2, latlab = 110, color =1, charsize = 1.9, /noerase
>
>
>
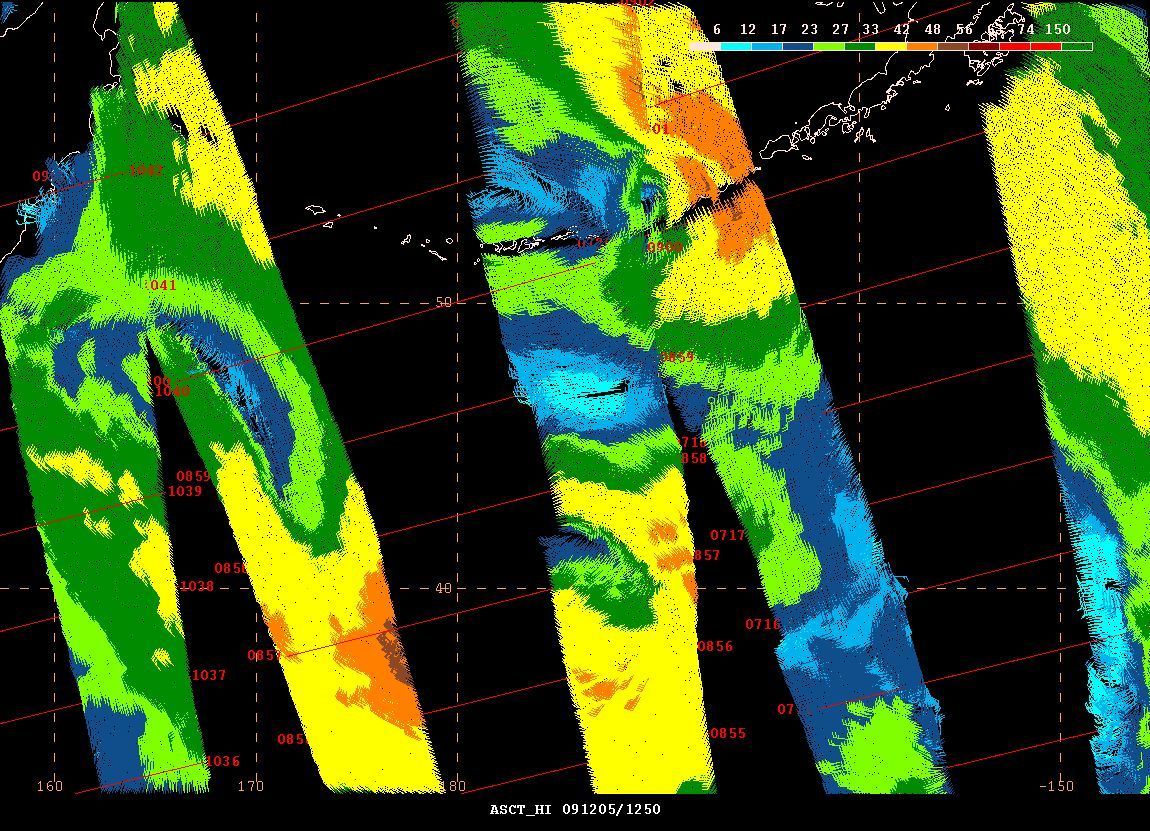
> A picture of what I am experiencing is here.
>
>
>
> http://www.vos.noaa.gov/MWL/apr_10/Images/pacific/Fig21P.jpg
>
>
>
>
>
> I was wanting to know if there is a way IDL can say where the overlap is and average the result between the two files in the overlap section.
>
>
>
> Thanks,
>
>
>
> Chase
|
 comp.lang.idl-pvwave archive
 Members
 Search
 Help
Help Login
Login Home
Home


")
