| Re: cgGallery with function graphics [message #87795 is a reply to message #87787] |
Thu, 27 February 2014 07:35   |
 Matthew Argall
Messages: 286
Registered: October 2011
|
Senior Member |
|
|
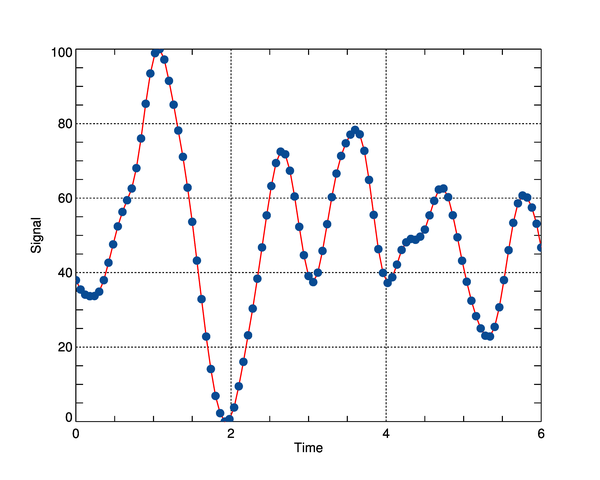
Grid On Line Plot
http://www.idlcoyote.com/gallery/grid_plot.png
==============
Copy + Paste Version
==============
; Example data. Normally passed into the program as a positional parameter.
data = cgScaleVector(cgDemoData(1), 30, 1200)
height = cgScaleVector(Findgen(N_Elements(data)), 0, 6)
thick = 2
; To label minor ticks on the axis use Martin Shultz program LogLevels.
; Set YTICKS to one less than the number of ticks returned by LogLevels.
ticks = LogLevels([10,2000])
nticks = N_Elements(ticks)
; Create the plot
ngPlot = Plot(time, data, Thick=thick, Color='Red', XTitle='Time', $
YTitle='Signal', Symbol='Circle', /Sym_Filled, Sym_Size=1.5, $
Sym_Color='Blue')
; Add the grid
; Note: There is a bug in IDL 8.2 that applies a minor tickmark grid for half of the grid.
(ngPlot.Axes)[0].TickLen = 1
(ngPlot.Axes)[0].GridStyle = 1
(ngPlot.Axes)[1].TickLen = 1
(ngPlot.Axes)[1].GridStyle = 1
============================================
Coyote Version
============================================
PRO Grid_On_Line_Plot_FG, WINDOW=window
; Example data. Normally passed into the program as a positional parameter.
data = cgScaleVector(cgDemoData(1), 30, 1200)
height = cgScaleVector(Findgen(N_Elements(data)), 0, 6)
thick = 2
; To label minor ticks on the axis use Martin Shultz program LogLevels.
; Set YTICKS to one less than the number of ticks returned by LogLevels.
ticks = LogLevels([10,2000])
nticks = N_Elements(ticks)
; Open a window and return its reference to the user.
aWindow = Window(WINDOW_TITLE="Grid on Line Plot")
; Create the plot
ngPlot = Plot(time, data, /Current, Thick=thick, Color='Red', XTitle='Time', $
YTitle='Signal', Symbol='Circle', /Sym_Filled, Sym_Size=1.5, $
Sym_Color='Blue')
; Add the grid
; Note: There is a bug in IDL 8.2 that applies a minor tickmark grid for half of the grid.
(ngPlot.Axes)[0].TickLen = 1
(ngPlot.Axes)[0].GridStyle = 1
(ngPlot.Axes)[1].TickLen = 1
(ngPlot.Axes)[1].GridStyle = 1
END ;*********************************************************** ******
; This main program shows how to call the program and produce
; various types of output.
; Display the plot in a resizeable graphics window.
Grid_On_Line_Plot_FG, Window=window
; Create a PostScript file. Linestyles are not preserved in IDL 8.2.3 due
; to a bug. Only encapsulated PostScript files can be created.
window.save, 'grid_on_line_plot_fg.eps'
; Create a PNG file with a width of 600 pixels. Resolution of this
; PNG file is not very good.
window.save, 'grid_on_line_plot_fg.png', WIDTH=600
; For better resolution PNG files, make the PNG full-size, then resize it
; with ImageMagick. Requires ImageMagick to be installed.
window.save, 'additional_axes_plot_fg_fullsize.png'
Spawn, 'convert grid_on_line_plot_fg_fullsize.png -resize 600 grid_on_line_plot_fg_resized.png'
END
|
|
|
|
 comp.lang.idl-pvwave archive
 Members
 Search
 Help
Help Login
Login Home
Home


")
