| Re: cgGallery with function graphics [message #87811 is a reply to message #87802] |
Thu, 27 February 2014 09:07   |
![Paul Van Delst[1] is currently offline](theme/default/images/xoffline.png.pagespeed.ic.XRkd1fkXye.png "Paul Van Delst[1] is currently offline") Paul Van Delst[1]
Paul Van Delst[1]
Messages: 1157
Registered: April 2002
|
Senior Member |
|
|
Setting of xrange and yrange is incorrect.
IDL> xrange = (fgContour.Axes)[0].Range
% AXIS: Unknown property: RANGE
IDL> yrange = (fgContour.Axes)[1].Range
% AXIS: Unknown property: RANGE
On 02/27/14 11:13, Matthew Argall wrote:
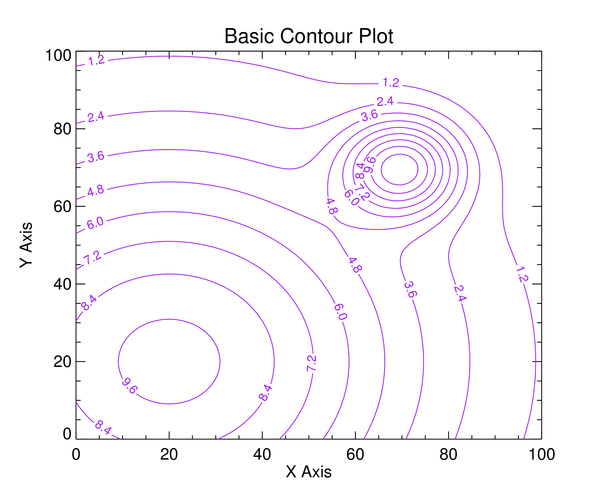
> Basic Contour Plot
> http://www.idlcoyote.com/gallery/basic_contour_plot.png
>
>
> =================
> Copy + Paste
> =================
> ; Example Gaussian data.
> data = cgDemoData(26)
>
> ; Set up variables for the contour plot. Normally, these values
> ; would be passed into the program as positional and keyword parameters.
> minValue = Floor(Min(data))
> nLevels = 10
> xtitle = 'X Axis'
> ytitle = 'Y Axis'
> position = [0.125, 0.125, 0.9, 0.9]
> title = 'Basic Contour Plot'
>
> ;Contour levels
> contourLevels = cgConLevels(data, NLevels=10, MinValue=minValue)
>
> ; Open a window and return its reference to the user.
> aWindow = Window(WINDOW_TITLE="Basic Contour Plot")
>
> ;Create a contour
> fgContour = Contour(data, /Current, C_Value=contourLevels, C_Color='Purple', $
> XTitle=xtitle, YTitle=ytitle, Title=title)
>
> ;Add the right and top axes
> ; In IDL 8.2.3+ set Location='Right' or 'Top' and skip finding [xy]range.
> xrange = (fgContour.Axes)[0].Range
> yrange = (fgContour.Axes)[1].Range
> xAxis = Axis('X', Target=fgContour, Location=[xrange[1], yrange[1], 0], $
> TickFormat='(A1)', TickDir=1)
> yAxis = Axis('Y', Target=fgContour, Location=[xrange[1], yrange[0], 0], $
> TickFormat='(A1)', TickDir=1)
>
|
|
|
|
 comp.lang.idl-pvwave archive
 Members
 Search
 Help
Help Login
Login Home
Home


")
