On Friday, April 1, 2016 at 2:51:49 PM UTC+2, steve...@metoffice.gov.uk wrote:
> I am new to object graphics and struggling to speed up a simple plot that contains multiple lines.
>
> Here is an example that plots 200 lines - the object graphics version is very slow compared to the direct graphics version.
>
> ;create some dummy data
> x = replicate(0.,11,200)
> y = x
> FOR i=0,199 DO x[*,i] = FINDGEN(11)
> FOR i=0,199 DO y[*,i] = RANDOMN(seed,11)
>
> ;plot in direct graphics
> plot,[0,10],[-5,5],/nodata,yrange=[-5,5],ystyle=1
> FOR i=0,199 DO oplot,x[*,i],y[*,i]
>
> ;plot in object graphics
> w = window()
> w.REFRESH, /DISABLE
> p = plot([0,10],[-5,5],/nodata,yrange=[-5,5],/current)
> FOR i=0,199 DO !NULL=plot(x[*,i],y[*,i],/overplot)
> w.REFRESH
>
>
> Is there any way to speed this up in object graphics?
>
> Thanks
>
> Steve
You probably mean 'function graphics' - 'object graphics' is a different system. I think the extra time is the price you pay for being able to resize, zoom, rotate etc with your results.
I've been using a home-baked system for anti-aliasing direct graphics since before FG. It comes out intermediate between DG and FG:
pro test1
;create some dummy data
x = replicate(0.,11,200)
y = x
FOR i=0,199 DO x[*,i] = FINDGEN(11)
FOR i=0,199 DO y[*,i] = RANDOMN(seed,11)
;plot in direct graphics
tic
plot,[0,10],[-5,5],/nodata,yrange=[-5,5],ystyle=1
FOR i=0,199 DO oplot,x[*,i],y[*,i]
toc
;plot in object graphics
tic
w = window()
w.REFRESH, /DISABLE
p = plot([0,10],[-5,5],/nodata,yrange=[-5,5],/current)
FOR i=0,199 DO !NULL=plot(x[*,i],y[*,i],/overplot)
w.REFRESH
toc
;plot in gmwindow
tic
gmw=obj_new("gmwindow")
gmw->plot,[0,10],[-5,5],/nodata,yrange=[-5,5],ystyle=1
FOR i=0,199 DO gmw->oplot,x[*,i],y[*,i],/no_draw
gmw->draw
toc
end
IDL> test1
% Time elapsed: 0.094000101 seconds.
% Time elapsed: 3.6379998 seconds.
% Time elapsed: 0.68700004 seconds.
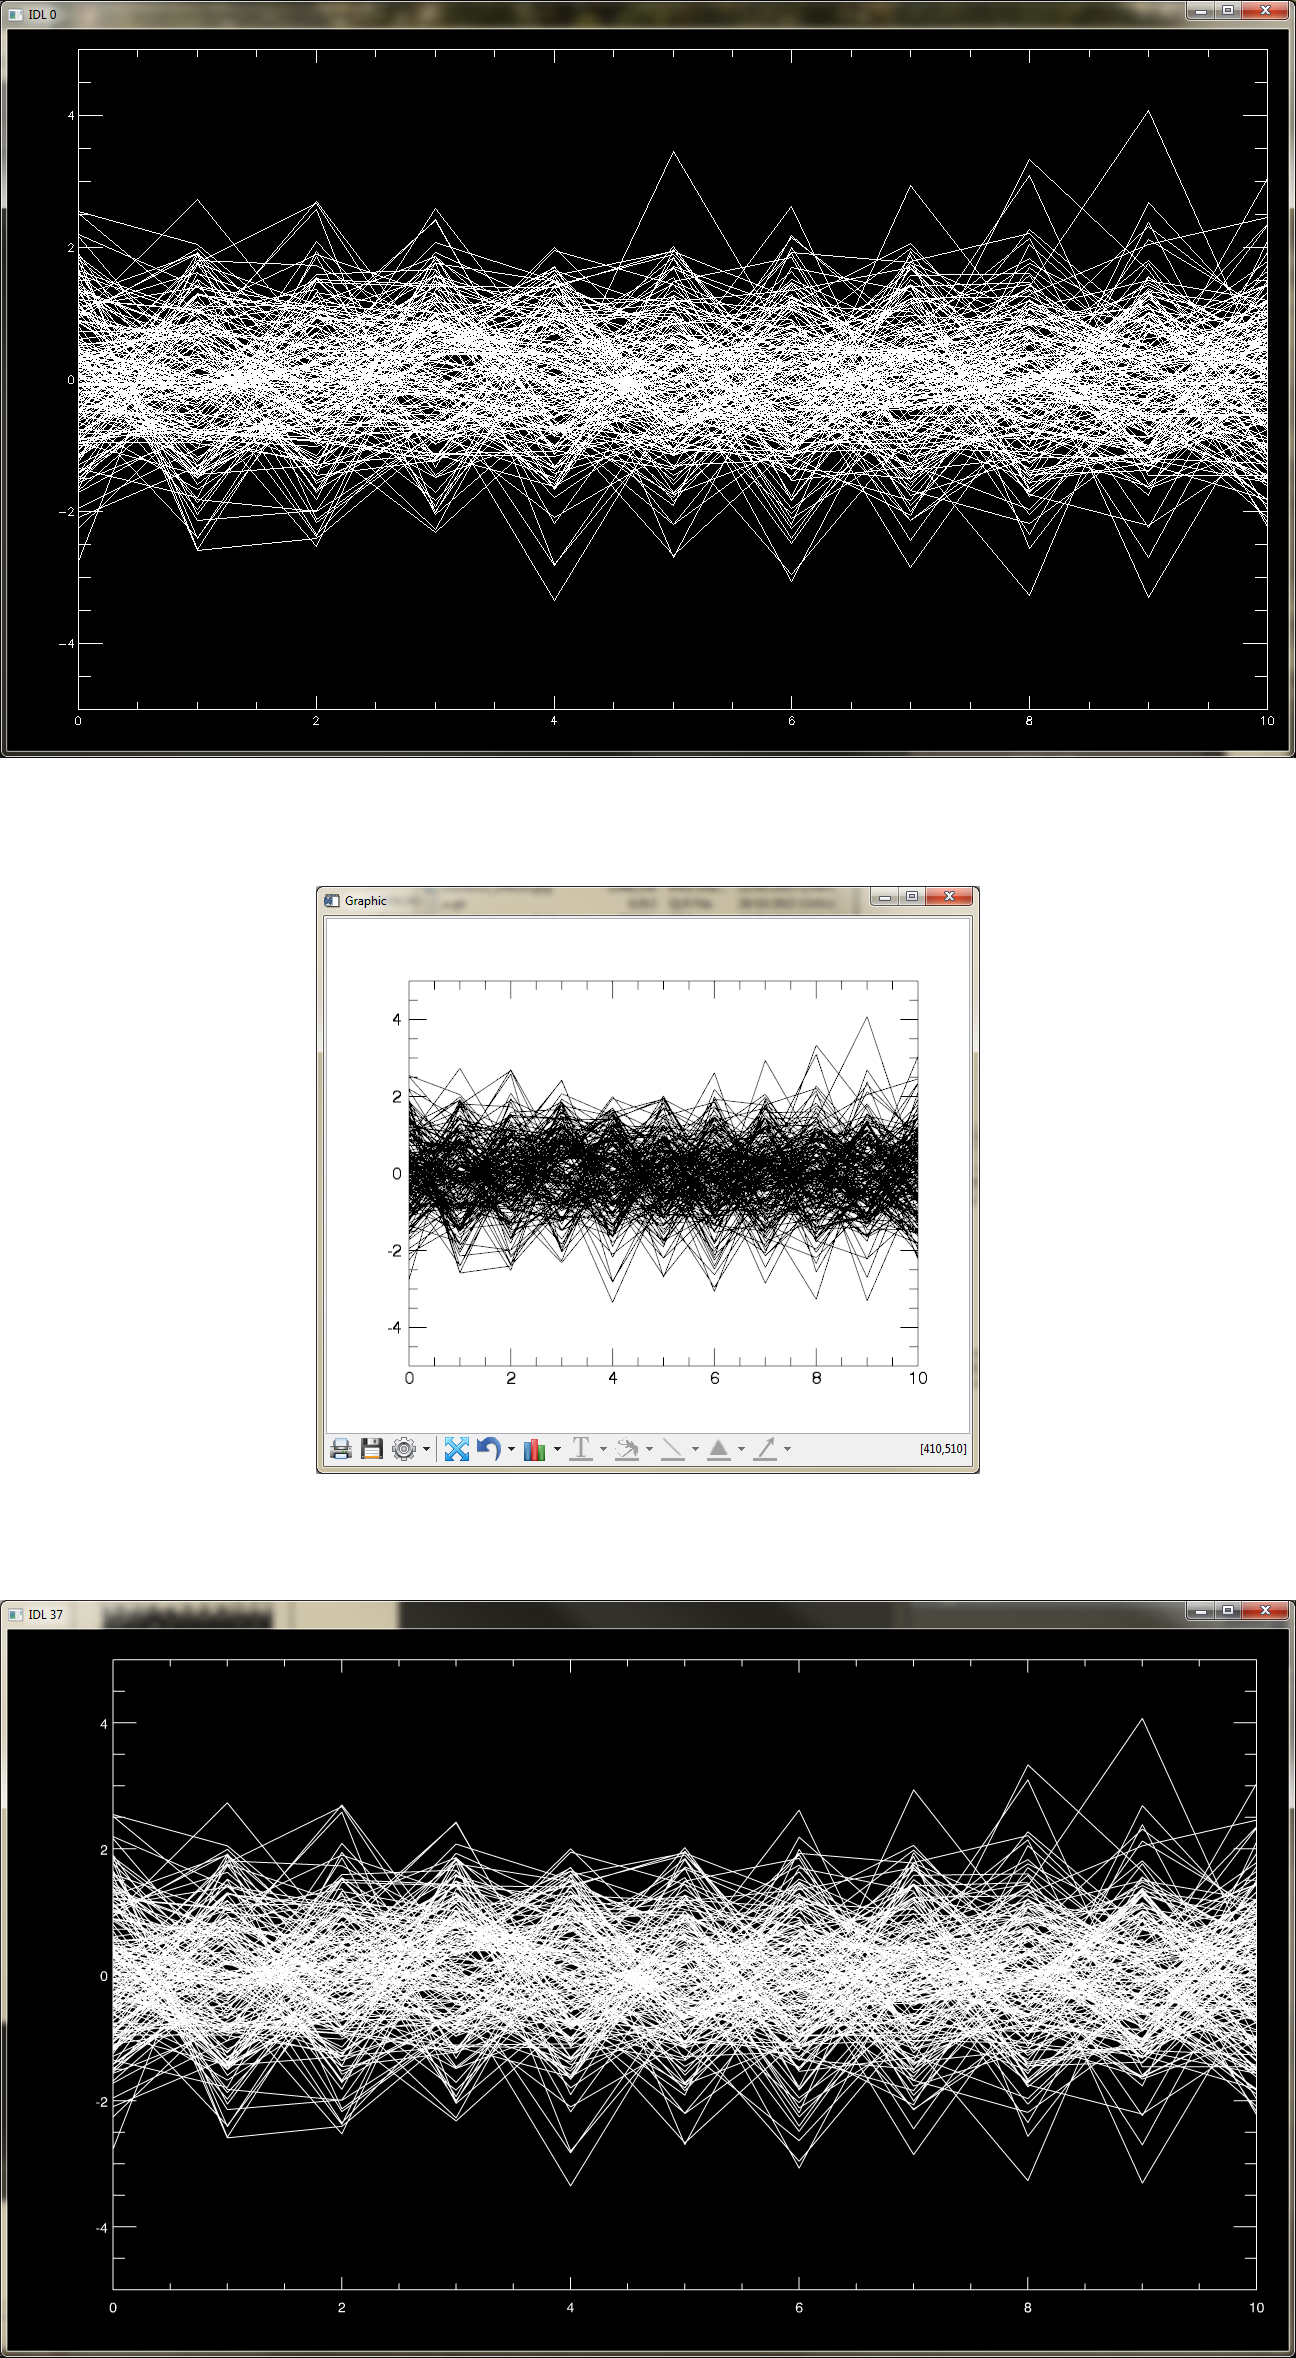
Output of all three are here: http://hrscview.fu-berlin.de/mex4/software/idl/gmwindow/dire ct_vs_function_vs_gmwindow.png
And the gmwindow code, here: http://hrscview.fu-berlin.de/mex4/software/idl/gmwindow/
cheers,
Greg
|
 comp.lang.idl-pvwave archive
 Members
 Search
 Help
Help Login
Login Home
Home


")
