On Monday, 4 April 2016 13:19:23 UTC+1, alx wrote:
> Le lundi 4 avril 2016 13:39:41 UTC+2, steve...@metoffice.gov.uk a écrit :
>> On Monday, 4 April 2016 12:12:21 UTC+1, alx wrote:
>>> Le lundi 4 avril 2016 12:49:33 UTC+2, steve...@metoffice.gov.uk a écrit :
>>>> On Monday, 4 April 2016 09:56:34 UTC+1, greg...@googlemail.com wrote:
>>>> > On Friday, April 1, 2016 at 2:51:49 PM UTC+2, steve...@metoffice.gov.uk wrote:
>>>> > > I am new to object graphics and struggling to speed up a simple plot that contains multiple lines.
>>>> > >
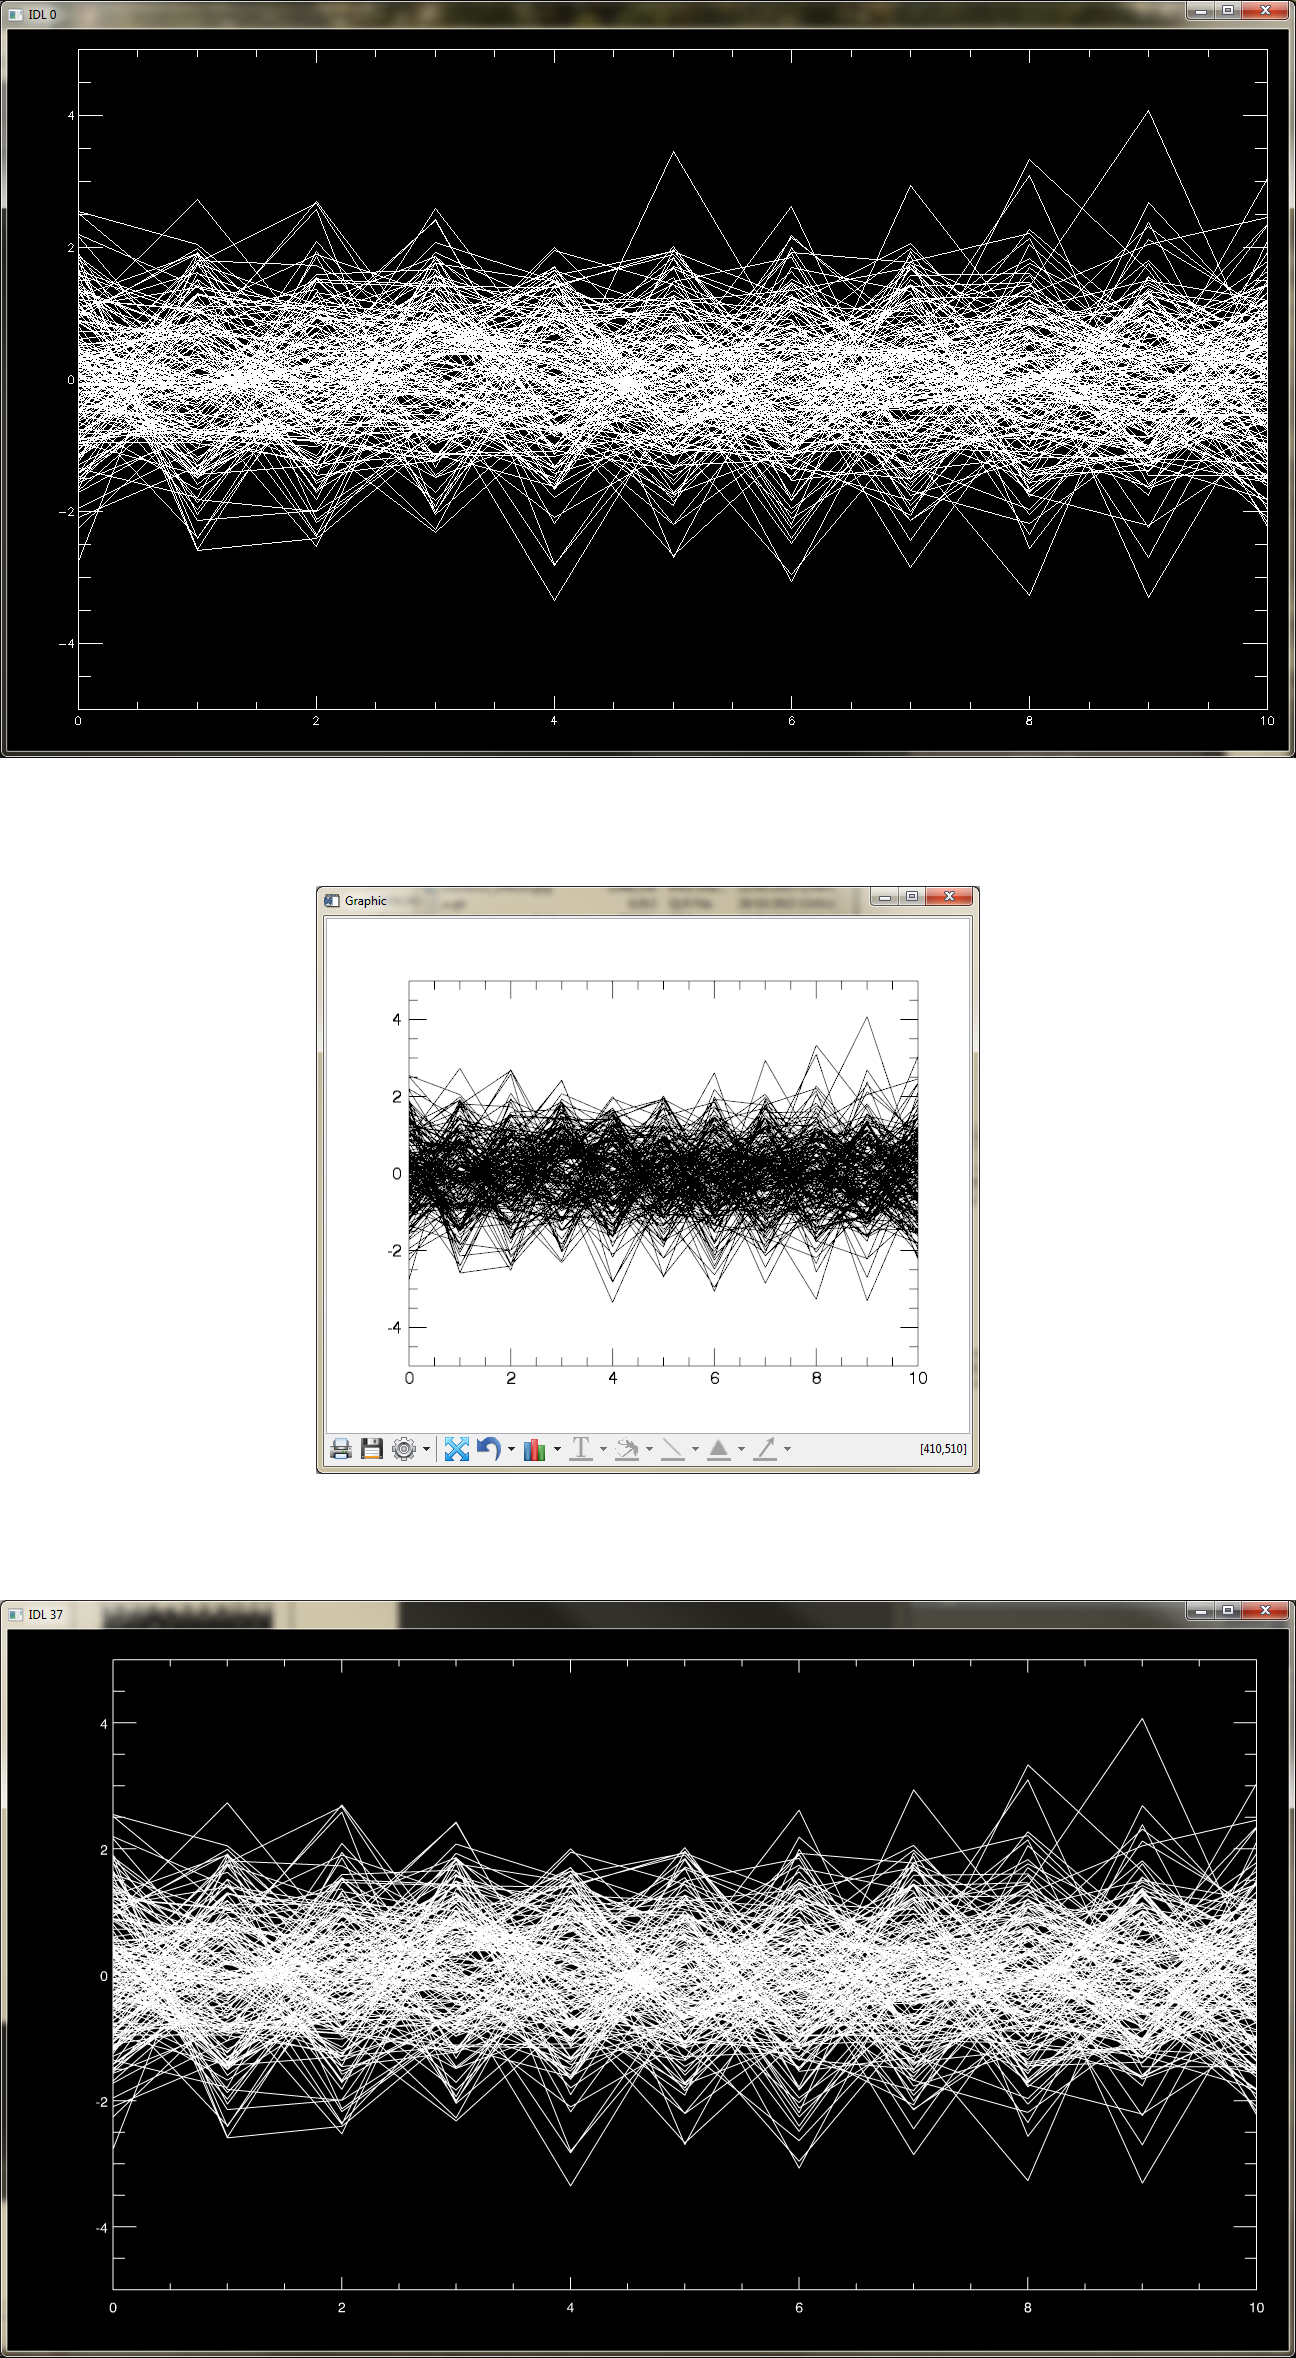
>>>> > > Here is an example that plots 200 lines - the object graphics version is very slow compared to the direct graphics version.
>>>> > >
>>>> > > ;create some dummy data
>>>> > > x = replicate(0.,11,200)
>>>> > > y = x
>>>> > > FOR i=0,199 DO x[*,i] = FINDGEN(11)
>>>> > > FOR i=0,199 DO y[*,i] = RANDOMN(seed,11)
>>>> > >
>>>> > > ;plot in direct graphics
>>>> > > plot,[0,10],[-5,5],/nodata,yrange=[-5,5],ystyle=1
>>>> > > FOR i=0,199 DO oplot,x[*,i],y[*,i]
>>>> > >
>>>> > > ;plot in object graphics
>>>> > > w = window()
>>>> > > w.REFRESH, /DISABLE
>>>> > > p = plot([0,10],[-5,5],/nodata,yrange=[-5,5],/current)
>>>> > > FOR i=0,199 DO !NULL=plot(x[*,i],y[*,i],/overplot)
>>>> > > w.REFRESH
>>>> > >
>>>> > >
>>>> > > Is there any way to speed this up in object graphics?
>>>> > >
>>>> > > Thanks
>>>> > >
>>>> > > Steve
>>>> >
>>>> > You probably mean 'function graphics' - 'object graphics' is a different system. I think the extra time is the price you pay for being able to resize, zoom, rotate etc with your results.
>>>> >
>>>> > I've been using a home-baked system for anti-aliasing direct graphics since before FG. It comes out intermediate between DG and FG:
>>>> >
>>>> > pro test1
>>>> > ;create some dummy data
>>>> > x = replicate(0.,11,200)
>>>> > y = x
>>>> > FOR i=0,199 DO x[*,i] = FINDGEN(11)
>>>> > FOR i=0,199 DO y[*,i] = RANDOMN(seed,11)
>>>> >
>>>> > ;plot in direct graphics
>>>> > tic
>>>> > plot,[0,10],[-5,5],/nodata,yrange=[-5,5],ystyle=1
>>>> > FOR i=0,199 DO oplot,x[*,i],y[*,i]
>>>> > toc
>>>> >
>>>> > ;plot in object graphics
>>>> > tic
>>>> > w = window()
>>>> > w.REFRESH, /DISABLE
>>>> > p = plot([0,10],[-5,5],/nodata,yrange=[-5,5],/current)
>>>> > FOR i=0,199 DO !NULL=plot(x[*,i],y[*,i],/overplot)
>>>> > w.REFRESH
>>>> > toc
>>>> >
>>>> > ;plot in gmwindow
>>>> > tic
>>>> > gmw=obj_new("gmwindow")
>>>> > gmw->plot,[0,10],[-5,5],/nodata,yrange=[-5,5],ystyle=1
>>>> > FOR i=0,199 DO gmw->oplot,x[*,i],y[*,i],/no_draw
>>>> > gmw->draw
>>>> > toc
>>>> >
>>>> > end
>>>> >
>>>> > IDL> test1
>>>> > % Time elapsed: 0.094000101 seconds.
>>>> > % Time elapsed: 3.6379998 seconds.
>>>> > % Time elapsed: 0.68700004 seconds.
>>>> >
>>>> > Output of all three are here: http://hrscview.fu-berlin.de/mex4/software/idl/gmwindow/dire ct_vs_function_vs_gmwindow.png
>>>> >
>>>> > And the gmwindow code, here: http://hrscview.fu-berlin.de/mex4/software/idl/gmwindow/
>>>> >
>>>> > cheers,
>>>> > Greg
>>>>
>>>> Thanks Greg
>>>>
>>>> Yes I did mean function graphics!
>>>>
>>>> The actual plot I am doing has six figures in the same window (each panel contains about 200 lines) and it takes several minutes to render this using function graphics on my Linux machine. Looks like for this plot at least I will have to revert to direct graphics.
>>>>
>>>> Cheers
>>>>
>>>> Steve
>>>
>>> The function PLOT(/OVERPLOT) does not work like the old OPLOT procedure: for each added new curve, the full environment of the already plotted graphics is recomputed and displayed (axis boundaries, etc...).
>>> In your case, you might (should) instead use the POLYLINE or POLYGON functions whose speed is amazing.
>>> alx.
>>
>> Thanks for pointing me to polyline - that speeds up my test case by about a factor of 4 (still a lot slower than direct graphics)
>>
>>
>> PRO test
>>
>> IRESOLVE
>>
>> ;create some dummy data
>> x = replicate(0.,11,200)
>> y = x
>> FOR i=0,199 DO x[*,i] = FINDGEN(11)
>> FOR i=0,199 DO y[*,i] = RANDOMN(seed,11)
>>
>>
>> ;plot in direct graphics
>> st=SYSTIME(/SECONDS)
>> plot,[0,10],[-5,5],/nodata,yrange=[-5,5],ystyle=1
>> FOR i=0,199 DO oplot,x[*,i],y[*,i]
>> PRINT,SYSTIME(/SECONDS)-st
>>
>> ;plot in function graphics 1
>> st=SYSTIME(/SECONDS)
>> w = window()
>> w.REFRESH, /DISABLE
>> p = plot([0,10],[-5,5],/nodata,yrange=[-5,5],/current)
>> FOR i=0,199 DO !NULL=plot(x[*,i],y[*,i],/overplot)
>> w.REFRESH
>> PRINT,SYSTIME(/SECONDS)-st
>>
>> ;plot in function graphics 2
>> st=SYSTIME(/SECONDS)
>> w = window()
>> w.REFRESH, /DISABLE
>> p = plot([0,10],[-5,5],/nodata,yrange=[-5,5],/current)
>> FOR i=0,199 DO !NULL=polyline(x[*,i],y[*,i],/data)
>> w.REFRESH
>> PRINT,SYSTIME(/SECONDS)-st
>>
>> END
>>
>> Time taken for these 3 plots
>>
>> IDL> print,!version
>> { x86_64 linux unix linux 8.2 Apr 10 2012 64 64}
>> IDL> test
>> % Compiled module: $MAIN$.
>> 0.0013258457
>> 18.797473
>> 4.7191000
>
> You might call POLYLINE only once by using the CONNECTIVITY keyword (i.e. by building a single *poly*line from your 200 initial lines). This should make everything even faster.
> alx.
Thanks for pointing me to that - took me a little while for me to understand the IDL documentation!
Using the connectivity keyword as below speeded it up significantly, with the test plot taking only 0.38 seconds on my machine. A big improvement on my initial implementation in function graphics!
xx=REFORM(x,n_elements(x))
yy=REFORM(y,n_elements(y))
conn = LONARR(n_elements(xx)+200)
FOR i = 0, 2400-1, 12 DO conn[i]=11
FOR i = 1, 2400-1, 12 DO conn[i:i+10]=LINDGEN(11)+i-FLOOR(i/12.)-1
;plot in function graphics 3
w = window()
w.REFRESH, /DISABLE
p = plot([0,10],[-5,5],/nodata,yrange=[-5,5],/current)
!NULL=polyline(xx,yy,connectivity=conn,/data,target=p)
w.REFRESH
Cheers
Ste
|
 comp.lang.idl-pvwave archive
 Members
 Search
 Help
Help Login
Login Home
Home


")
