On Wednesday, 23 November 2016 05:42:05 UTC-8, fvel...@gmail.com wrote:
> Dear:
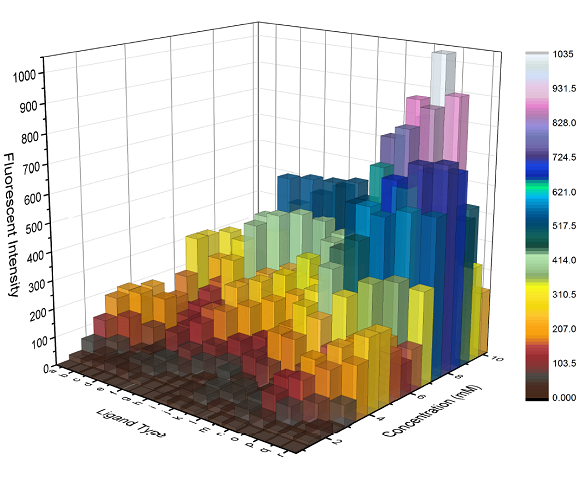
> I love programing in IDL, and I would like to plot a 3D histogram like this
> http://cloud.originlab.com/www/resources/graph_gallery/image s_galleries_new/3DBarsWithZColorMap_opengl.png
>
> do you think is it possible? Some suggestions for starting?
> Thanks guys
> Fher
Hi Fher,
Yes, I think it's possible, and not terribly difficult. Here's a start:
PRO Histogram3DDisplay
n = 10
w = 1 ; 0.9999
oAxes = ObjArr(3)
oBoxes = ObjArr(n, n)
oFrames = ObjArr(n, n)
FOR axisI=0, 2 DO oAxes[axisI] = IDLgrAxis(axisI, RANGE=[0, n])
; Connectivity list for a rectangular solid:
poly = [4,0,1,5,4,4,1,2,6,5,4,2,3,7,6,4,3,0,4,7,4,3,2,1,0,4,4,5,6,7 ]
FOR x=0, n-1 DO FOR y=0, n-1 DO BEGIN
z = RandomU(seed) * n
color = [RandomU(seed)*256, RandomU(seed)*256, RandomU(seed)*256]
verts = [[x+w,y+w,0],[x,y+w,0],[x,y,0],[x+w,y,0], $ ; Bottom face
[x+w,y+w,z],[x,y+w,z],[x,y,z],[x+w,y,z]] ; Top face
oBoxes[x, y] = IDLgrPolygon(verts, POLYGONS=poly, ALPHA_CHANNEL=0.75, $
COLOR=color)
oFrames[x, y] = IDLgrPolygon(verts, POLYGONS=poly, STYLE=1)
ENDFOR
; Default colorbar has x size of 24, y size of 256
oColorbar = Obj_New('IDLgrColorbar', /SHOW_OUTLINE, /SHOW_AXIS, /THREED)
oColorbarModel = IDLgrModel()
oColorbarModel.Add, oColorbar
oColorbarModel.Scale, n/256., n/256., n/256. ; Scale to match plot size
oColorbarModel.Translate, n*1.5, 0, 0 ; Shift to right of plot
XObjView, [oAxes, oBoxes[*], oFrames[*]], STATIONARY=oColorbarModel
END
; Notes:
;
; I find that I have to click the window to get the display to draw
; (might be just on my setup).
;
; If you change window size, click the Reset button in the toolbar to set
; display axes right.
;
; Do View:Set Drag Quality:High for full-motion goodness.
;
; Note that the semi-transparency looks better from some angles than others,
; due to how transparency rendering is handled (don't be surprised if some
; old-timers chime in, saying something about pimentos). Reordering the faces
; in the 'polygons' array could solve this for viewing from a particular
; segment of space.
;
; Change 'w' from 1 to 0.9999 to avoid some artifacts of rendering coplanar
; faces.
;
; Using a colortable with XObjView is tricky: it's stationary, but it's part
; of the scene, so scene rotation is not centered on the plot.
;
; Dick Jackson, www.d-jackson.com
Check up on IDLgrColorbar and the TICKTEXT property of IDLgrAxis for more of what you see in that image you referred to.
I was going to suggest starting a Plot3D window (newer Function Graphics), then adding the coloured boxes into that, but I couldn't track down how to add them to the *data* space of that graphic. (Can anyone help here? Might this result in better rendering?) To add things into a Function Graphics *window* (which won't let you rotate them, etc.), you can do:
IDL> myPlot = Plot3D()
IDL> myPlotWindow = myPlot.Window
IDL> myPlotWindow, Add, <models, objects, etc.>
... or see examples here:
http://www.harrisgeospatial.com/Company/PressRoom/Blogs/IDLD ataPointDetail/TabId/902/ArtMID/2926/ArticleID/14264/Combini ng-Object-Graphics-and-New-Graphics.aspx
Hope this helps!
-Dick
Dick Jackson Software Consulting Inc.
Victoria, BC, Canada --- http://www.d-jackson.com
|
 comp.lang.idl-pvwave archive
 Members
 Search
 Help
Help Login
Login Home
Home


")
