Hello,
How can I include a scale bar within the Google Map plot below? (For example, I wanted something like the one at the following link: http://www.androidcentral.com/google-maps-update-brings-back -scale-bar).
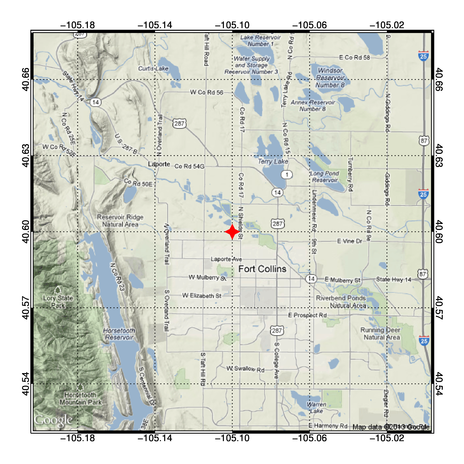
Assume the Google Map plot is something similar to the following:
http://www.idlcoyote.com/gallery/google_map_plot.png
Can anyone suggest me how I can do that?
My program is as below:
----------------------------------------
PRO test_GooglePlot
CLOSE,/ALL
Lats=[51.51D,51.55D] ; deg.N
Lons=[12.91D,12.95D] ; deg E
centerLat=(MAX(Lats) + MIN(Lats)) / 2.0 ; deg. N
centerLon=(MAX(Lons) + MIN(Lons)) / 2.0 ; deg. E
zoom=14
scale=cgGoogle_MetersPerPixel(zoom)
xsize= 600 < 640 ; Max size of Google image with this Google API
ysize= 600 < 640 ; Max size of Google image with this Google API
resolution = STRTRIM(xsize,2) + 'x' + STRTRIM(ysize,2)
googleImageFilename='testgoogleimg.png'
googleStr="http://maps.googleapis.com/maps/api/staticmap?" + $
"center=" + StrTrim(centerLat,2) + ',' + StrTrim(centerLon,2) + $
"&zoom=" + StrTrim(zoom,2) + "&size=" + resolution + $
" &scale=2&maptype=satellite&sensor=true&forma t=png32 "
netObject = Obj_New('IDLnetURL')
void = netObject -> Get(URL=googleStr, FILENAME=googleImageFilename)
Obj_Destroy, netObject
googleImage = Read_Image(googleImageFilename)
mapCoord = Obj_New('cgMap', 'Mercator', ELLIPSOID='WGS 84') ; ,/OnImage
uv = mapCoord -> Forward(centerLon, centerLat)
uv_xcenter = uv[0,0]
uv_ycenter = uv[1,0]
xrange = [uv_xcenter - (xsize/2.0D*scale), uv_xcenter + (xsize/2.0D*scale)]
yrange = [uv_ycenter - (ysize/2.0D*scale), uv_ycenter + (ysize/2.0D*scale)]
mapCoord -> SetProperty, XRANGE=xrange, YRANGE=yrange
PRINT, xrange, yrange
geo_lat=[51.5256, 51.5290, 51.5296, 51.5261, 51.5269, 51.5250, 51.5256, $
51.5260, 51.5300, 51.5264, 51.5255, 51.5252, 51.5271, 51.5257, $
51.5253, 51.5249, 51.5201, 51.5220, 51.5256, 51.5260, 51.5251, $
51.5265, 51.5257, 51.5186, 51.5227, 51.5257, 51.5198, 51.5361, $
51.5263, 51.5200, 51.5350, 51.5312, 51.5187, 51.5260, 51.5260, $
51.5247, 51.5257, 51.5217, 51.5266, 51.5264, 51.5255, 51.5265, $
51.5260, 51.5252, 51.5287, 51.5277, 51.5227, 51.5251, 51.5341, $
51.5248]
geo_lon=[12.9289, 12.9264, 12.9259, 12.9223, 12.9135, 12.9254, 12.9277, $
12.9272, 12.9280, 12.9264, 12.9257, 12.9262, 12.9421, 12.9272, $
12.9272, 12.9272, 12.9410, 12.9229, 12.9254, 12.9288, 12.9373, $
12.9279, 12.9267, 12.9291, 12.9307, 12.9179, 12.9373, 12.9405, $
12.9313, 12.9202, 12.9277, 12.9350, 12.9134, 12.9264, 12.9256, $
12.9254, 12.9262, 12.9274, 12.9285, 12.9256, 12.9281, 12.9272, $
12.9280, 12.9290, 12.9200, 12.9319, 12.9273, 12.9282, 12.9167, $
12.9263]
cgPlotS, geo_lon, geo_lat, PSYM=16, SYMSIZE=2.0, MAP=mapCoord, $
THICK=2.5, COLOR='yellow'
END
test_GooglePlot
cgPS_Open,'test_googleplot.ps'
test_GooglePlot
cgPS_Close
cgPS2Raster,'test_googleplot.ps',/PNG,/Portrait, $
Width=600, DENSITY=300, RESIZE=100
END
-------------------------------------------------------
Thanks in advance,
Regards,
Madhavan
|
 comp.lang.idl-pvwave archive
 Members
 Search
 Help
Help Login
Login Home
Home


")
