|
|
| Re: histogram 3D [message #93914 is a reply to message #93909] |
Wed, 23 November 2016 12:00   |
 Dick Jackson
Messages: 347
Registered: August 1998
|
Senior Member |
|
|
On Wednesday, 23 November 2016 05:42:05 UTC-8, fvel...@gmail.com wrote:
> Dear:
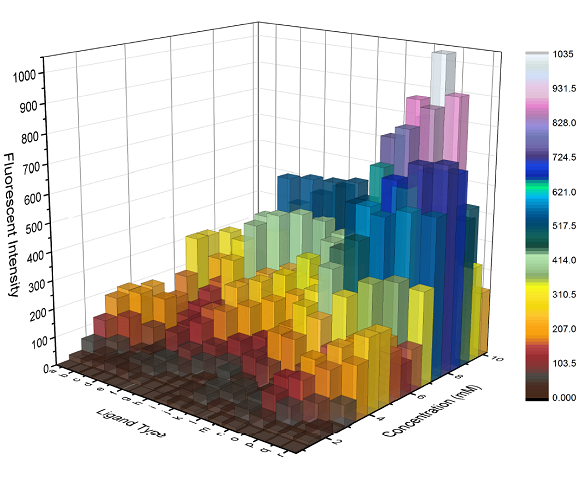
> I love programing in IDL, and I would like to plot a 3D histogram like this
> http://cloud.originlab.com/www/resources/graph_gallery/image s_galleries_new/3DBarsWithZColorMap_opengl.png
>
> do you think is it possible? Some suggestions for starting?
> Thanks guys
> Fher
Hi Fher,
Yes, I think it's possible, and not terribly difficult. Here's a start:
PRO Histogram3DDisplay
n = 10
w = 1 ; 0.9999
oAxes = ObjArr(3)
oBoxes = ObjArr(n, n)
oFrames = ObjArr(n, n)
FOR axisI=0, 2 DO oAxes[axisI] = IDLgrAxis(axisI, RANGE=[0, n])
; Connectivity list for a rectangular solid:
poly = [4,0,1,5,4,4,1,2,6,5,4,2,3,7,6,4,3,0,4,7,4,3,2,1,0,4,4,5,6,7 ]
FOR x=0, n-1 DO FOR y=0, n-1 DO BEGIN
z = RandomU(seed) * n
color = [RandomU(seed)*256, RandomU(seed)*256, RandomU(seed)*256]
verts = [[x+w,y+w,0],[x,y+w,0],[x,y,0],[x+w,y,0], $ ; Bottom face
[x+w,y+w,z],[x,y+w,z],[x,y,z],[x+w,y,z]] ; Top face
oBoxes[x, y] = IDLgrPolygon(verts, POLYGONS=poly, ALPHA_CHANNEL=0.75, $
COLOR=color)
oFrames[x, y] = IDLgrPolygon(verts, POLYGONS=poly, STYLE=1)
ENDFOR
; Default colorbar has x size of 24, y size of 256
oColorbar = Obj_New('IDLgrColorbar', /SHOW_OUTLINE, /SHOW_AXIS, /THREED)
oColorbarModel = IDLgrModel()
oColorbarModel.Add, oColorbar
oColorbarModel.Scale, n/256., n/256., n/256. ; Scale to match plot size
oColorbarModel.Translate, n*1.5, 0, 0 ; Shift to right of plot
XObjView, [oAxes, oBoxes[*], oFrames[*]], STATIONARY=oColorbarModel
END
; Notes:
;
; I find that I have to click the window to get the display to draw
; (might be just on my setup).
;
; If you change window size, click the Reset button in the toolbar to set
; display axes right.
;
; Do View:Set Drag Quality:High for full-motion goodness.
;
; Note that the semi-transparency looks better from some angles than others,
; due to how transparency rendering is handled (don't be surprised if some
; old-timers chime in, saying something about pimentos). Reordering the faces
; in the 'polygons' array could solve this for viewing from a particular
; segment of space.
;
; Change 'w' from 1 to 0.9999 to avoid some artifacts of rendering coplanar
; faces.
;
; Using a colortable with XObjView is tricky: it's stationary, but it's part
; of the scene, so scene rotation is not centered on the plot.
;
; Dick Jackson, www.d-jackson.com
Check up on IDLgrColorbar and the TICKTEXT property of IDLgrAxis for more of what you see in that image you referred to.
I was going to suggest starting a Plot3D window (newer Function Graphics), then adding the coloured boxes into that, but I couldn't track down how to add them to the *data* space of that graphic. (Can anyone help here? Might this result in better rendering?) To add things into a Function Graphics *window* (which won't let you rotate them, etc.), you can do:
IDL> myPlot = Plot3D()
IDL> myPlotWindow = myPlot.Window
IDL> myPlotWindow, Add, <models, objects, etc.>
... or see examples here:
http://www.harrisgeospatial.com/Company/PressRoom/Blogs/IDLD ataPointDetail/TabId/902/ArtMID/2926/ArticleID/14264/Combini ng-Object-Graphics-and-New-Graphics.aspx
Hope this helps!
-Dick
Dick Jackson Software Consulting Inc.
Victoria, BC, Canada --- http://www.d-jackson.com
|
|
|
|
| Re: histogram 3D [message #93918 is a reply to message #93914] |
Wed, 23 November 2016 15:21 |
Jim Pendleton
Messages: 165
Registered: November 2011
|
Senior Member |
|
|
On Wednesday, November 23, 2016 at 1:00:37 PM UTC-7, Dick Jackson wrote:
> On Wednesday, 23 November 2016 05:42:05 UTC-8, fvel...@gmail.com wrote:
>> Dear:
>> I love programing in IDL, and I would like to plot a 3D histogram like this
>> http://cloud.originlab.com/www/resources/graph_gallery/image s_galleries_new/3DBarsWithZColorMap_opengl.png
>>
>> do you think is it possible? Some suggestions for starting?
>> Thanks guys
>> Fher
>
> Hi Fher,
>
> Yes, I think it's possible, and not terribly difficult. Here's a start:
>
> PRO Histogram3DDisplay
>
> n = 10
> w = 1 ; 0.9999
>
> oAxes = ObjArr(3)
> oBoxes = ObjArr(n, n)
> oFrames = ObjArr(n, n)
>
> FOR axisI=0, 2 DO oAxes[axisI] = IDLgrAxis(axisI, RANGE=[0, n])
>
> ; Connectivity list for a rectangular solid:
> poly = [4,0,1,5,4,4,1,2,6,5,4,2,3,7,6,4,3,0,4,7,4,3,2,1,0,4,4,5,6,7 ]
>
> FOR x=0, n-1 DO FOR y=0, n-1 DO BEGIN
>
> z = RandomU(seed) * n
> color = [RandomU(seed)*256, RandomU(seed)*256, RandomU(seed)*256]
>
> verts = [[x+w,y+w,0],[x,y+w,0],[x,y,0],[x+w,y,0], $ ; Bottom face
> [x+w,y+w,z],[x,y+w,z],[x,y,z],[x+w,y,z]] ; Top face
> oBoxes[x, y] = IDLgrPolygon(verts, POLYGONS=poly, ALPHA_CHANNEL=0.75, $
> COLOR=color)
> oFrames[x, y] = IDLgrPolygon(verts, POLYGONS=poly, STYLE=1)
> ENDFOR
>
> ; Default colorbar has x size of 24, y size of 256
> oColorbar = Obj_New('IDLgrColorbar', /SHOW_OUTLINE, /SHOW_AXIS, /THREED)
> oColorbarModel = IDLgrModel()
> oColorbarModel.Add, oColorbar
> oColorbarModel.Scale, n/256., n/256., n/256. ; Scale to match plot size
> oColorbarModel.Translate, n*1.5, 0, 0 ; Shift to right of plot
>
> XObjView, [oAxes, oBoxes[*], oFrames[*]], STATIONARY=oColorbarModel
>
> END
>
> ; Notes:
> ;
> ; I find that I have to click the window to get the display to draw
> ; (might be just on my setup).
> ;
> ; If you change window size, click the Reset button in the toolbar to set
> ; display axes right.
> ;
> ; Do View:Set Drag Quality:High for full-motion goodness.
> ;
> ; Note that the semi-transparency looks better from some angles than others,
> ; due to how transparency rendering is handled (don't be surprised if some
> ; old-timers chime in, saying something about pimentos). Reordering the faces
> ; in the 'polygons' array could solve this for viewing from a particular
> ; segment of space.
> ;
> ; Change 'w' from 1 to 0.9999 to avoid some artifacts of rendering coplanar
> ; faces.
> ;
> ; Using a colortable with XObjView is tricky: it's stationary, but it's part
> ; of the scene, so scene rotation is not centered on the plot.
> ;
> ; Dick Jackson, www.d-jackson.com
>
> Check up on IDLgrColorbar and the TICKTEXT property of IDLgrAxis for more of what you see in that image you referred to.
>
> I was going to suggest starting a Plot3D window (newer Function Graphics), then adding the coloured boxes into that, but I couldn't track down how to add them to the *data* space of that graphic. (Can anyone help here? Might this result in better rendering?) To add things into a Function Graphics *window* (which won't let you rotate them, etc.), you can do:
>
> IDL> myPlot = Plot3D()
> IDL> myPlotWindow = myPlot.Window
> IDL> myPlotWindow, Add, <models, objects, etc.>
>
> ... or see examples here:
> http://www.harrisgeospatial.com/Company/PressRoom/Blogs/IDLD ataPointDetail/TabId/902/ArtMID/2926/ArticleID/14264/Combini ng-Object-Graphics-and-New-Graphics.aspx
>
> Hope this helps!
> -Dick
>
> Dick Jackson Software Consulting Inc.
> Victoria, BC, Canada --- http://www.d-jackson.com
I'm a fairly old-timer, but I won't mention pimentos.
Transparency isn't necessarily intuitive. The order in which objects reside in their model tree defines the alpha blending, rather than the Z-order of the objects.
Generally speaking, you want to order your objects in their models so that that the ones more distant from the eye are first in the render order.
If you make an interactive 3D scene, you may need to reorder the objects in the model tree "on the fly" as you rotate the objects if you want it to "look right" a majority of the time. Now this also assumes there are not objects embedded within other objects, as well. Extra points for that one.
Jim P.
|
|
|
|
 comp.lang.idl-pvwave archive
 Members
 Search
 Help
Help Login
Login Home
Home


")
