
Fill an Area Under a Curve
QUESTION: Given that I have a function, y = f(x), how do I fill the area under the curve between two values of x?
![]()
ANSWER: What you are going to do is use your function values, x and y, to create a polygon that can be filled with cgColorFill. It is probably easier to show you how it is done than it is to explain it to you. You will find other examples of plots like this in the Coyote Plot Gallery. Here is an example.
First, create your x and y values:
   x = Findgen(101)
   y = 4 * Sin(x * !DtoR) / Exp( (x-15) / 25.)
Next, draw the basic plot.
   cgDisplay, 750, 500, Title='Filled Area Under a Curve'
   cgPlot, x, y, Background=background, Color='red', /NoData
Next, set the low and high values that define the limits of the area you wish to fill with a color. In this case, let's color the area under the curve from x=20 to x=45.
   low = 20
   high = 45
Next, find the y values associated with these x values from the equation for the curve. You will also need the index numbers into the x vector that are closest to these two x values. Make sure the x value at the low index is greater than the low value and the x value at the high index is less than the high value. Move your indices, if necessary. The code will look like this:
   lowY  = 4 * Sin(low * !DtoR) / Exp( (low-15) / 25.)
   highY = 4 * Sin(high * !DtoR) / Exp( (high-15) / 25.)
   indices = Value_Locate(x, [low, high])
   lowIndex = indices[0]
   highIndex = indices[1]
   IF x(lowIndex) LT low THEN lowIndex = lowIndex + 1
   IF x(highIndex) GT high THEN highIndex = highIndex - 1
The next step is to create a polygon from the information at hand. You will need two additional points on the front of the polygon made from the two curves, and two additional points on the rear of the polygon. This is to make the polygon extend from the bottom of the plot up to the curve itself. The code looks like this:
   xpoly = [         low,  low, x[lowIndex:highIndex],  high,         high]
   ypoly = [!Y.CRange[0], lowY, y[lowIndex:highIndex], highY, !Y.CRange[0]]
   cgColorFill, xpoly, ypoly, Color='dodger blue'
   cgPlotS, xpoly, ypoly, Color='bisque', Thick=2
Finally, you will need to re-apply the lines of the plot and curve to repair any damage created by the polygon filling operation. Type this:
   cgPlot, x, y, /NoData, /NoErase
   cgOPlot, x, y, Color='red', Thick=3
The results are shown in the figure below. I've written a short program, named ColorFill, that you can modify to use with your own data.
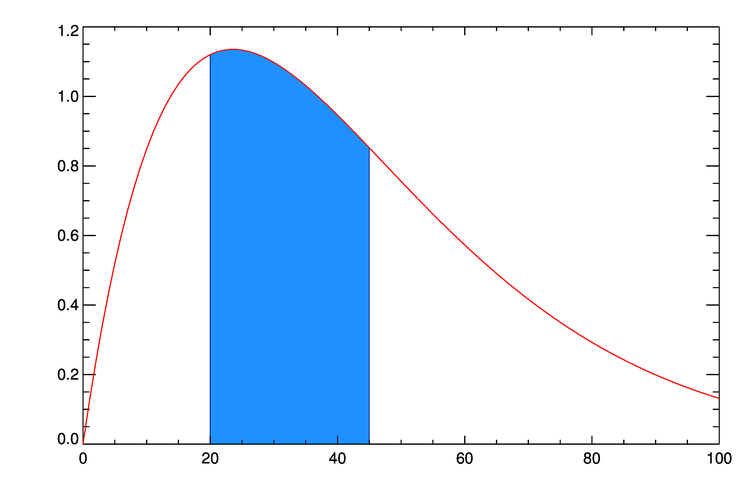
![]()
Written: 18 January 2003
Last Updated: 16 October 2012