
Fitting a Gaussian to a Histogram Plot
QUESTION: I love the way the cgHistoplot program calculates and displays a histogram. But what I would like to do is fit the result with a Gaussian function and overplot the fitted data over the histogram in the display output. Is this possible? Can you show me how to do it?
![]()
ANSWER: Yes, it is possible. The cgHistoplot program is already set up with the proper output keywords to allow you to do this easily. I'll show you an example of fitting a Gaussian function to the data, since you asked specifically about that, but the method would apply, in general, to any type of fit you wished to make.
Let's start by creating some data to display.
data = cgDemoData(5)
This particular image has a great many missing values, indicated by the value 0. This will certainly skew the histogram plot. There are several ways we might handle this, but perhaps the easiest way it to just set these values to NANs before we do the analysis. This will cause these values to be ignored when the histogram is calculated.
    i = Where(data EQ 0, count)    IF count GT 0 THEN BEGIN
	data = Float(data)         data[i] = !Values.F_NAN    ENDIF
[Editor's Note: As of 20 July 2009, the cgHistoplot program has a Missing keyword that can be used to identify a value that should be excluded from the histogram calculation, making the above data manipulation unnecessary. Simply set the Missing keyword to a value of 0 in the cgHistoplot command below.]
Now we create the histogram plot with the cgHistoplot command. The HistData, Locations, and BinSize keywords will all be output keywords. (The BinSize keyword can also be in input keyword, but in this case, the variable binsize is undefined when we call the cgHistoplot command, so it will return the bin size value calculated in the program.)
cgHistoplot, data, /FILL, HISTDATA=h, LOCATIONS=loc, BINSIZE=binsize
You see the results of the command in the figure below.
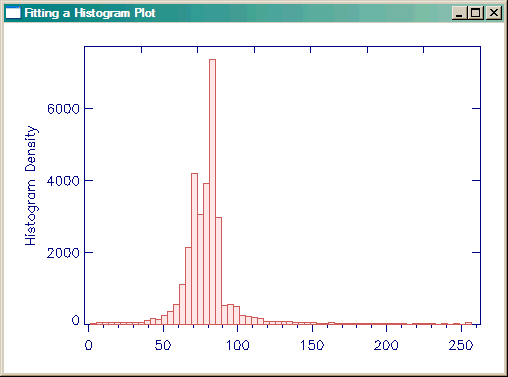 |
| The normal histogram plot with the cgHistplot command. |
The variable h now contains the histogram data you wish to fit the Gaussian to, and the variable loc contains the starting locations of each bin. You will want to fit to the center of each bin, which is why you also recovered the binsize variable. You can perform the Gaussian fit with the GaussFit command in IDL. Note that the coefficents of the fit (maximum value, center, and standard deviation) will come back as a three-element array in the variable coeff.
   binCenters = loc + (binsize / 2.0)
   yfit = GaussFit(binCenters, h, coeff, NTERMS=3)
   cgPlot, binCenters, yfit, COLOR='dodger blue', THICK=2, /OVERPLOT
You can see the results of the fit in the figure below.
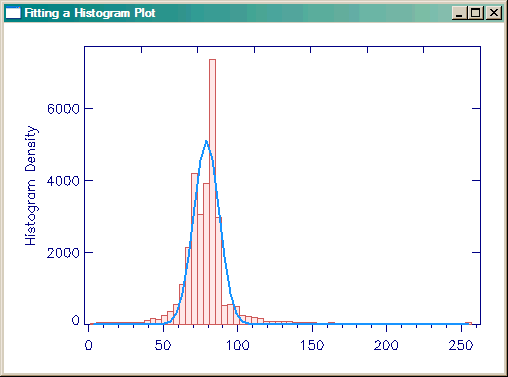 |
| The Gaussian fitted histogram plot. |
If you like, you can output fit parameters maximum value, center, and full-width-half-maximum on the plot as well.
   maxfit = String(coeff[0], FORMAT='(F0.2)')
   centerfit = String(coeff[1], FORMAT='(F0.2)')
   fwhm = String(2 * SQRT(2 * ALOG(2)) * coeff[2], FORMAT='(F0.2)')
   cgText, 0.5, 0.85, /NORMAL, 'Maximum: ' + maxfit, COLOR='navy'
   cgText, 0.5, 0.80, /NORMAL, 'Center: ' + centerfit, COLOR='navy'
   cgText, 0.5, 0.75, /NORMAL, 'FWHM: ' + fwhm, COLOR='navy'
The final results are shown in the figure below.
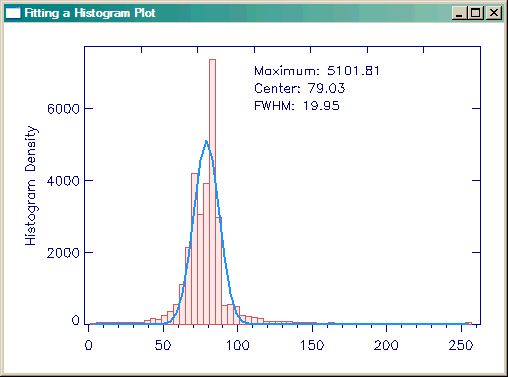 |
| The Gaussian fitted histogram plot with fit parameters displayed. |
![]()
Version of IDL used to prepare this article: IDL 7.0.3.
![]()
Copyright © 2009 David W. Fanning
Written: 18 July 2009
Updated: 20 July 2009