
Adding a Grid to a Line Plot
QUESTION: I would like to add a grid to my line plot in IDL, but I can't figure out how to do it. Is there an easy way?
![]()
ANSWER: Yes, adding a grid to a line plot is actually quite simple in IDL. It simply involves setting the [XY]Ticklen keywords to 1. The line style of the grid lines can be changed with the [XY]GridStyle keywords. For example, you might do this in IDL.
    data = RandomU(-3L, 11)*10
   cgPlot, data, Background='ivory', AxisColor='navy', $
      XTicklen=1.0, YTicklen=1.0, XGridStyle=1, YGridStyle=1, $
      XTitle='Time', YTitle='Signal'
You see the results of these commands in the figure below.
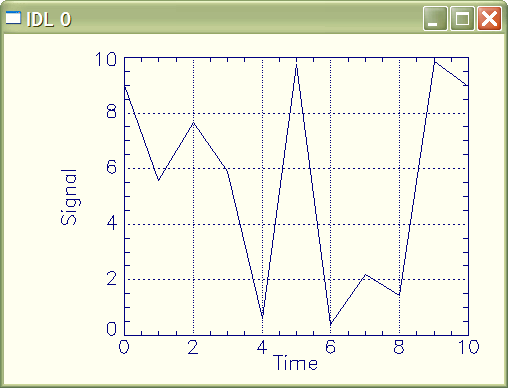 |
| A plot with a basic grid. |
Often, though, you would like to have a little more dramatic a presentation of the data. And you would like the grid to fade more into the background, so it doesn't take away from the importance of the data. Here is another way of doing this line plot, in which the grid lines are a different color from the other plot attributes.
    data = RandomU(-3L, 11)*10
   cgPlot, data, /NoData, AxisColor='dodger blue', Background='ivory', $
       XTickFormat='(A1)', YTickFormat='(A1)', XTicklen=1.0, YTicklen=1.0, $
       XGridStyle=1, YGridStyle=1
   cgPlot, data, /NoData, /NoErase, AxisColor='navy', XTitle='Time', YTitle='Signal'
   cgOPlot, data, Color='indian red', Thick=2
   cgOPlot, data, Color='olive', PSym=2, Thick=2, SymSize=1.5
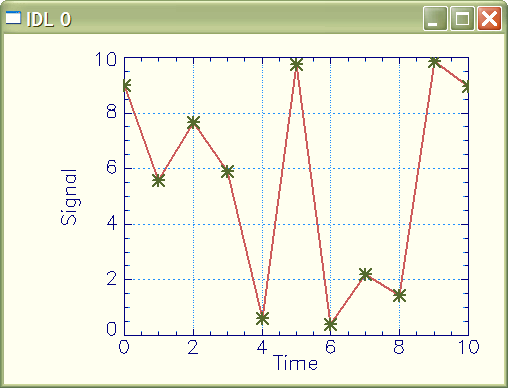 |
| A plot with grid lines in a different color than the plot axes. |
![]()
Version of IDL used to prepare this article: IDL 7.0.3.
![]()
Copyright © 2008 David W. Fanning
Last Updated 7 August 2008