
Overlapping Histogram Plots
QUESTION: I read your article on Creating a Transparent Color Image with cgBlendImage, but my problem is a little different. I have two histograms I want to display as filled histogram plots, but I want the area of overlap between the two histograms to appear transparent. Is it possible to do this in IDL?
![]()
ANSWER: Yes, it is possible. And the technique is very much the same one I demonstrated for images, with one simple twist. You need two 24-bit images to blend with BlendImage, as before, but you have to be careful how you create those two 24-bit images. One image needs to be created with the first histogram behind the second. And the other image needs to be created with the second image behind the first. Otherwise, it will be impossible to get the original colors of the histograms to come out correctly. Let me demonstrate.
First, let's create some data for the overlapping histograms.
data_1 = randomn(-3L, 1000) data_2 = randomn(-5L, 1000) + 5
First, draw the second histogram behind the first. This means, naturally, that you will have to draw the second histogram first, and the first overplotted on top of it. Note that for this to work, you will have to have the histogram plot set up exactly the same for the two images you wish to blend. This means you will probably have to set the axes ranges by hand. Don't allow IDL or the program to do this. You may have to experiment a bit to see what these ranges should be. We will use Coyote Library cgHistoplot command to draw the histogram plots. When we are finished drawing the two plots, we will capture the contents of the window as a 24-bit image with the Coyote Library cgSnapshot command.
    cgHistoplot, data_2, POLYCOLOR='olive', /FILL, $
       YRANGE=[0,200], XRANGE=[-5,3], BINSIZE=binsize
   cgHistoplot, data_1, POLYCOLOR='yellow', /FILL, /OPLOT, BINSIZE=binsize
   firstPlot = cgSnapshot()
Note that in this case, BINSIZE is being used as an output keyword in the first Histoplot command, but as an input keyword in subsequent Histoplot commands. This will keep the histogram bin sizes identical through the sequence of plots.
Now, create the second plot, with the histogram plots in reverse order. This will be the second plot.
    cgHistoplot, data_1, POLYCOLOR='yellow', /FILL, $
       YRANGE=[0,200], XRANGE=[-5, 3], BINSIZE=binsize
   cgHistoplot, data_2, /OPLOT, POLYCOLOR='olive', /FILL, BINSIZE=binsize
   secondPlot = cgSnapshot()
The final step is simply to blend the two images together in the window.
cgBlendimage, firstPlot, secondPlot, ALPHA=0.75
You can see the end result in the figure below.
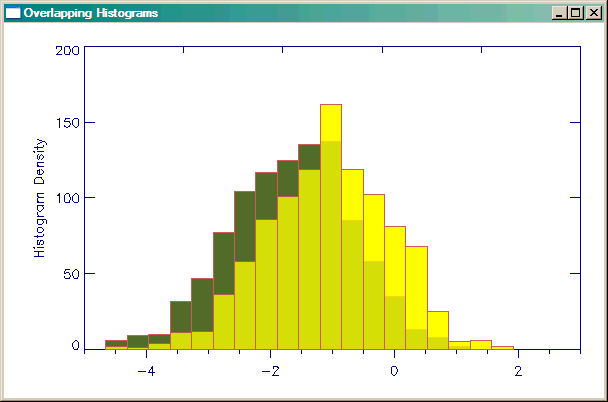 |
| Overlapping, transparent histogram plots. |
![]()
Version of IDL used to prepare this article: IDL 7.0.3.
![]()
Copyright © 2009-2011 David W. Fanning
Last Updated 11 March 2011