
Reversing an Plot Axis
QUESTION: I have monthly pressure data that ranges from 10 to 1000 millibars. I'd like to plot this time series, but I want the Y axis to show log values from 1000 to 10. No matter how I set up the plot, however, the Y axis is labelled from 10 to 1000. Is there any way to make IDL do what I want it to do? Here is what I am trying right now:
   Plot, [1997, 2004], [1000, 10], YStyle=1, YLog=1, $
      YTitle='Pressure', /NoData
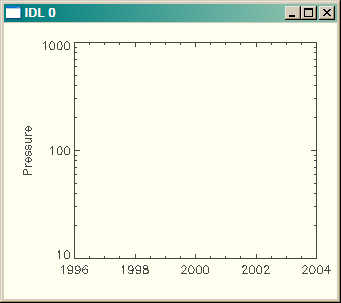 |
| This how a normal Y axis looks. |
![]()
ANSWER: To reverse an axis in IDL, you have to reverse the values you supply in the [XYZ]Range keyword. You can solve your immediate problem by just adding YRANGE=[1000,10] to your Plot command.
   Plot, [1997, 2004], [1000, 10], YStyle=1, YLog=1, $
      YTitle='Pressure', /NoData, YRange=[1000,10]
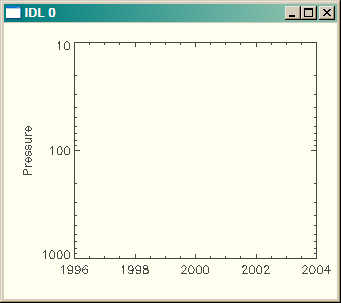 |
| The Y axis is now reversed. |
![]()
Copyright © 2006 David W. Fanning
Last Updated 22 February 2006