
X Axis Labels at Top of Plot
QUESTION: Is it possible to have the X axis labels at the top of the plot instead of at the bottom?
![]()
ANSWER: Yes, sorta. Try something like this.
   Plot, Findgen(11), XStyle=8, XTickformat='(A1)', Position=[0.15, 0.15, 0.9, 0.85], $
      YTitle='This is the Y Axis Title'
   Axis, XAxis=1, XTitle='This is the X Axis Title'
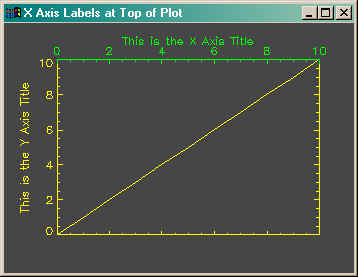
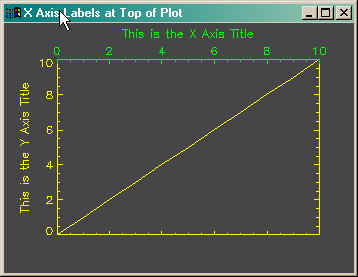
Notice, however, that when drawn like this that the X axis title gets awfully close to the numbers on the X axis. Especially so if you compare then to the Y axis title and numbers. This is probably OK for noodling around at the command line, but I wouldn't want to publish something like this. I'd probably put the X axis title on by hand, using XYOutS.
   Plot, Findgen(11), XStyle=8, XTickformat='(A1)', Position=[0.15, 0.15, 0.9, 0.85], $
      YTitle='This is the Y Axis Title'
   Axis, XAxis=1
   XYOutS, (!X.Window[1] - !X.Window[0]) / 2 + !X.Window[0], 0.94, /Normal, $
      Alignment=0.5, 'This is the X Axis Title'
![]()
Last Updated 3 January 2003