
Plotting Image Profiles in IDL
QUESTION: How can I create an image profile (a plot of the image values) along any arbitrary line that I want to draw on an image?
![]()
ANSWER: Plotting an image profile is extremely easy to do in IDL. Suppose, for example, that you had an image and some point (col,row) expressed in device coordinates located somewhere within the boundaries of the image. A column profile is easily plotted like this:
   image = cgDemoData(7)
   cgPlot, image(col, *)
The row profile is similarly plotted, like this:
cgPlot, image(*, row)
It is almost as easy to plot the profile along any arbitrarily drawn line on the image. The key is knowing how to use the Interpolate command in IDL. (Thanks to Ray Sterner for showing me how to do this.) Suppose your two endpoints were given by (x1,y1) and (x2,y2). To calculate an image profile along the line, you must know the image values at discrete points along the line. There are, of course, an infinity of points along the line from which you can calculate the image value, but in practice I like to use the larger of the endpoint differences. My IDL code looks like this:
   x1 = 50 & x2 = 310
   y1 = 200 & y2 = 25
   nPoints = ABS(x2-x1+1) > ABS(y2-y1+1)
Next, you must construct two vectors containing the X and Y locations, respectively, of these points. This is easily done in IDL, like this:
   xloc = x1 + (x2 - x1) * Findgen(nPoints) / (nPoints - 1)
   yloc = y1 + (y2 - y1) * Findgen(nPoints) / (nPoints - 1)
Finally, the profile values are calculated by interpolating the image values at these locations along the line with the Interpolate command. (These will be bilinearly interpolated values, by default.) The code looks like this:
   profile = Interpolate(image, xloc, yloc)
   cgPlot, profile
If you prefer nearest neighbor interpolation, you can use the Round function in IDL, like this:
   profile = Interpolate(image, Round(xloc), Round(yloc))
   cgPlot, profile
Notice that this method will work even with lines that are not straight! For example, you might let the user select a series of points with the mouse that describes a curved line along the image. This method would also produce a profile of the image values along that curved line.
![]()
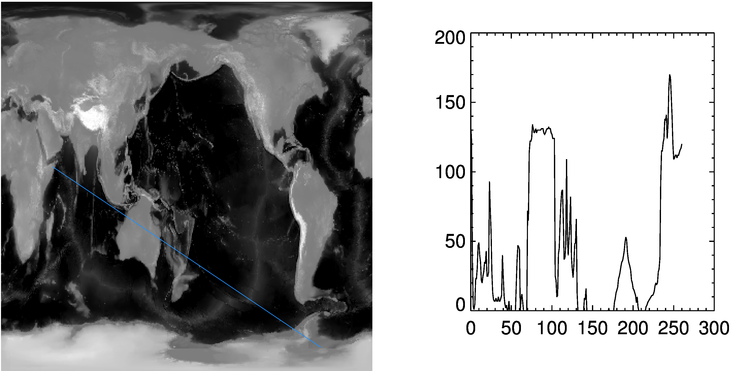
You can see an example of the image profile plotted in the illustration below.
   cgDisplay, 600, 300
   !P.Multi = [0,2,1]
   cgImage, image, /Save
   cgPlotS, [x1,x2], [y1,y2], Color='dodger blue', Thick=2
   cgPlot, profile
   !P.Multi = 0
![]()
Copyright © 1997 David W. Fanning
Last Updated 11 April 1997