
Displaying a Power Spectrum
QUESTION: How can I calculate and display the power spectrum of a 2D image?
![]()
ANSWER: The power spectrum is a representation of the the magnitude of the various frequency components of a 2D image that has been transformed with the FFT command from the spacial domain into the frequency domain. Different frequencies in the power spectrum are located at different distances and directions from the origin. (The origin is customarily located in the center of the power spectrum.) Higher frequency components of the image will be located at greater distances from the origin. Different directions from the origin will represent different orientations of features in the image.
The power at each location in the power spectrum is an indication of the frequency and orientation of a particular feature in the image. Evaluating the power spectrum is an excellent way to isolate periodic structural features or noise in the image. Since the power can vary by orders of magnitude in an image, the power spectrum is usually represented on a log scale.
To see how to calculate and display the power spectrum of an image, open the image file convec.dat, which is among the files Research Systems provides with its demonstation directories. Your IDL code will look something like this. (Click here to download the entire example IDL code.)
   file = FILEPATH('convec.dat', SUBDIR=['examples', 'data'])
   OPENR, lun, file, /GET_LUN
   convec = BYTARR(248,248)
   READU, lun, convec
   FREE_LUN, lun
Open a window, load a color table, and display the unprocessed image in the left side of the window, like this:
   WINDOW, 0, XSIZE=248*2, YSIZE=248
   LOADCT, 13
   TV, convec
The next step is to transform the image from the spacial domain into the frequency domain with the FFT function, like this:
freqDomainImage = FFT(convec, -1)
To see the power spectrum of this image next to the image, type this. You may have to play around a little bit with the image scaling to get a power spectrum to look "right" to you. After scaling, I put the image into cgStretch to find the proper proper histogram stretch for good viewing. (That's where the minimum and maximum values for the BytScl command come from.)
power = SHIFT(ALOG(ABS(freqDomainImage)), xsize/2, ysize/2)
power = power - Min(power)
power = power * (255.0/Max(power))
TV, BytScl(power, Min=50, Max=150), xsize, 0
You can see from the power spectrum that this image has lots of periodic structure at increasing frequencies. Your display screen should look similar to the illustration below.
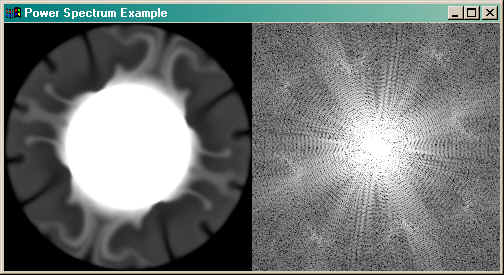
![]()
Copyright © 1997-2002 David W. Fanning
Last Updated 6 November 2002