
Positioning Object Graphics Axes
QUESTION: I am having trouble positioning my axes in my viewport. Sometimes they extend out of the view and sometimes they don't align properly. It is almost as if they are too big. Can you explain what is going on here?
![]()
ANSWER: There are two things you have to worry about with axes: (1) How to position them where you want them in your coordinate system, and (2) How to scale them properly so they fit into your coordinate system. I'm not sure which is more difficult to understand from the documentation. Sigh...
Locating Axes in the Coordinate System
Axes are located in the 3D object graphics coordinate system by means of the Location keyword, which is a three-element vector. The documentation states that this is the coordinate "through which the axis should pass", but this is slightly misleading. In fact, one of the elements of this vector is ignored entirely. For example, if you are specifying an X axis, the first element of this vector is ignored. If you are specifying a Y axis, the second element is ignored, and so forth.
I think it is more helpful to think of the vector as indicating the point in a plane that the axis should penetrate. For example, consider an X axis defined like this:
   xAxis = Obj_New("IDLgrAxis", 0, Color=[255,255,0], Ticklen=0.025, $
    Minor=4, Range=xrange, Title=xtitle, Location=[9999, 50 , 100])
In a 3D space, the X axis will penetrate the YZ plane. Given the Location keyword above, the axis will penetrate the YZ plane at the YZ point (50,100). Note that the X value in the Location array is ignored. (I like to give the ignored element a large value to remind myself that it can be anything at all.)
If I were creating a Y axis, I might define it like this:
   yAxis = Obj_New("IDLgrAxis", 1, Color=[255,255,0], Ticklen=0.025, $
    Minor=4, Range=yrange, Title=ytitle, Location=[25, 9999 , 50])
Here, the Y axis penetrates the XZ plane at the XZ location (25,50).
Scaling Axes in the Coordinate System
Sometimes the more difficult problem is how to scale the axes into the viewplane rectangle correctly. Consider some data that has a range from 0 to 32. If I have a coordinate system that goes from -0.35 to 1.35 in both the X and Y directions, then I might define the box axes of a line plot to enclose the rectangle given by the points (0,0) and (1,1) like this:
yrange = [Min(y), Max(y)
xrange = [0, N_Elements(y)-1]

xAxis1 = Obj_New("IDLgrAxis", 0, Color=[255,255,0], Ticklen=0.025, $
    Minor=4, Range=xrange, Title=xtitle, Location=[1000, 0 ,0])

xAxis2 = Obj_New("IDLgrAxis", 0, Color=[255,255,0], Ticklen=0.025, $
    Minor=4, /NoText, Range=xrange, TickDir=1, Location=[1000, 1, 0])

yAxis1 = Obj_New("IDLgrAxis", 1, Color=[255,255,0], Ticklen=0.025, $
    Minor=4, Title=ytitle, Range=yrange, Location=[0, 1000, 0])

yAxis2 = Obj_New("IDLgrAxis", 1, Color=[255,255,0], Ticklen=0.025, $
    Minor=4, /NoText, Range=yrange, TickDir=1, Location=[1, 1000, 0])
To scale these axes into my viewplane rectangle, I might do this (using the cgNormalize program from the Coyote Library to create the scaling factors):
    ; Calculate scaling factors.

xs = Normalize(xrange)
ys = Normalize(yrange)

    ; Scale the axes into 0->1.

xAxis1->SetProperty, XCoord_Conv=xs
xAxis2->SetProperty, XCoord_Conv=xs
yAxis1->SetProperty, YCoord_Conv=ys
yAxis2->SetProperty, YCoord_Conv=ys
But when I look at the plot, I see that the Y axes actually extend past the box that I was hoping to create. You see an example in the illustration below.
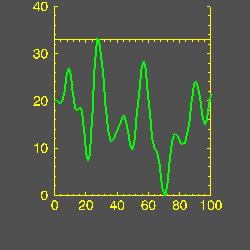
The reason for this is that the axes are auto-scaling. Even though I asked for a particular axes range (corresponding to the data range), I got something different. IDL auto-scales axes to produce axes that can be labelled nicely.
But nicely labelled axes can play havoic if you are not expecting them!
To get the correct scaling, I need to get the actual data range after the axes are created and use that to calculate the scaling factors. I can get the actual data ranges from the axes by using the CRange keyword with the GetProperty method. (Alternatively, I can use exact axis scaling by setting the Exact keyword in the axis creation routine, in which case I don't have to worry about getting the actual range.)
For example, my code should really look like this:
    ; Get the actual data ranges for the axes.

xAxis1->GetProperty, CRange=xrange
yAxis1->GetProperty, CRange=yrange

    ; Calculate scaling factors.

xs = Normalize(xrange)
ys = Normalize(yrange)

    ; Scale the axes into 0->1.

xAxis1->SetProperty, XCoord_Conv=xs
xAxis2->SetProperty, XCoord_Conv=xs
yAxis1->SetProperty, YCoord_Conv=ys
yAxis2->SetProperty, YCoord_Conv=ys
You see the result of getting the actual axes ranges to do the scaling in the illustraion below.
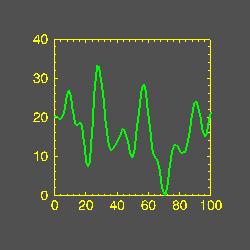
These ideas are further illustrated in these two programs from the Coyote Library: XPlot, and XSurface.
![]()
Copyright © 1999 David W. Fanning
Last Updated 13 May 1999