
How to Create 3D Axes
The simplest way to create a set of 3D axes in IDL is to use the SURFACE command with the NODATA keyword. The advantage of this is that you can use the normal keywords to get the axes and the axes labels exactly the way you want them. You can also rotate the surface in various ways with the AX and AZ keywords.
The trick in setting up a 3D coordinate space is to save the 3D transformation in the !P.T system variable. You can do this with the SAVE keyword to the surface command.
Normally, I use the [XYZ]RANGE keywords to set the axes limits, and plot any old kind of data on the plot. (The DIST function is always useful for this purpose.)
Your code might look like this:
   SURFACE, DIST(5), /NODATA, /SAVE, XRANGE=[MIN(x), MAX(x)], $
      YRANGE=[MIN(y), MAX(y)], ZRANGE=[MIN(z), MAX(z)], XSTYLE=1, $
      YSTYLE=1, ZSTYLE=1, CHARSIZE=1.5
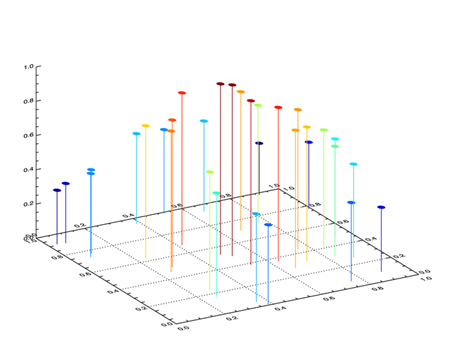
Here is an example of a 3D scatterplot of random data as an example of how the SURFACE command can be used to create a set of 3D axes.
   PRO SCATTER3D

      ; Create the random data. Set the seed so you see what I see.

   seed = 1L
   x = RANDOMU(seed, 32)
   y = RANDOMU(seed, 32)
   z = EXP(-3 * ((x - 0.5)^2 + (y - 0.5)^2))

      ; Load a color table and create colors for the scatterplot.

   LOADCT, 38, NCOLORS=!D.N_COLORS-1
   TVLCT, 70, 70, 70, !D.N_COLORS-1
   zcolors = BYTSCL(z, TOP=!D.N_COLORS-2)

      ; Set the 3D coordinate space with axes.

   SURFACE, DIST(5), /NODATA, /SAVE, XRANGE=[0,1], $
      YRANGE=[0,1], ZRANGE=[0, 1], XSTYLE=1, $
      YSTYLE=1, ZSTYLE=1, CHARSIZE=1.5, COLOR=!D.N_COLORS-2, $
      BACKGROUND=!D.N_COLORS-1, $
      POSITION=[0.1, 0.1, 0.95, 0.95, 0.1, 0.95]

      ; Plot the random points in 3D space with a diamond shape.

   PLOTS, x, y, z, PSYM=4, COLOR=zcolors, SYMSIZE=2.5, /T3D

      ; Connect the data points to the XY plane of the plot.

   FOR j=0,31 DO PLOTS, [x(j), x(j)], [y(j), y(j)], [0, z(j)], $
      COLOR=zcolors(j), /T3D

   END
You can see an example of the 3D scatterplot in the illustration below.
![]()
Last Updated 2 December 1996