
Adding a Legend to a Coyote Graphics Window
QUESTION: Can you show me an easy way to add a legend to a Coyote Graphics window in IDL?
![]()
ANSWER: Many IDL programmers add legends to their graphics displays with the NASA IDL Astronomy Library program AL_Legend. This program has been modified to use Coyote Graphics commands, making it extremely easy to use it with Coyote Graphics windows. IDL programers like AL_Legend because it has a great many features, is flexible, and is relatively easy to use. You can find examples of graphics plots that use AL_Legend to produce legends in the Coyote Plot Gallery.
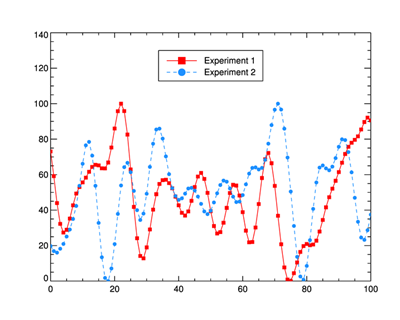
The following code, for example, creates a plot with two data sets and labels them with a legend in the upper left hand corner of the plot. The plot is created in a resizeable Coyote Graphics window. The legend is added to the window by simply setting the Window keyword on the AL_Legend command.
   cgPlot, cgDemoData(17), PSym=-15, Color='red', YRange=[0,120], $
      LineStyle=0, YStyle=1, /Window
   cgPlot, cgDemoData(17), PSym=-16, Color='dodger blue', /Overplot, $
      LineStyle=2, /AddCmd
   AL_Legend, ['Experiment 1', 'Experiment 2'], PSym=[-15,-16], $
      LineStyle=[0,2], Color=['red','dodger blue'], Position=[5,115], /Window
You see an example of what the code produces in the figure below.
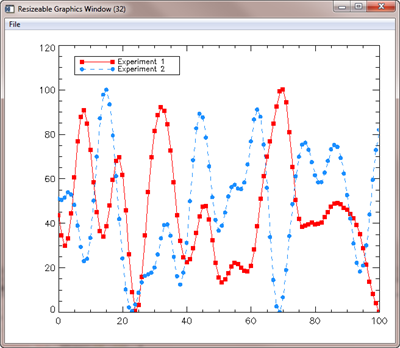 |
| A plot in a resizeable Coyote Graphics window with a legend. |
![]()
Legends with cgLegend
The Coyote Graphics system comes with its own cgLegend routine to produce simple legends for your plots. This routine has fewer features than AL_Legend, but in some ways works better with Coyote Graphics routines. You will want to choose the one that works best for you. With cgLegend, the commands above turn into these.
   cgPlot, cgDemoData(17), PSym=-15, Color='red', YRange=[0,120], $
      LineStyle=0, YStyle=1, /Window
   cgPlot, cgDemoData(17), PSym=-16, Color='dodger blue', /Overplot, $
      LineStyle=2, /AddCmd
   cgLegend, Title=['Experiment 1', 'Experiment 2'], PSym=[-15,-16], $
      LineStyle=[0,2], Color=['red','dodger blue'], Location=[5,115], $
      /Data, /AddCmd
You see the results in the figure below. You will notice a couple of differences. First, is the absence of a box around the legend. This is an optional feature in cgLegend and is created by setting the Box keyword. The Position keyword has been renamed Location to distinguish it as a two-element array, rather than the expected four element array that the Position keyword is so often used for. Note that in cgLegend, the Location is typically given in normalized coordinates. The Data keyword is needed here to indicate the location is in data coordinate space. Finally, the legend will resize as you resize the window to maintain the same relative space in the window. The legend in AL_Legend does not resize.
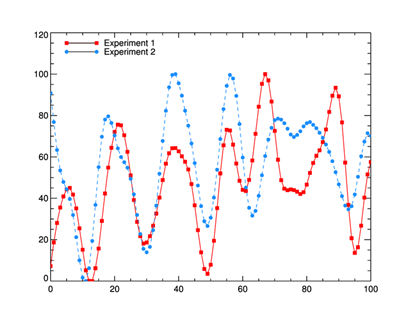 |
| A plot with the legend drawn with cgLegend. |
There are a great many options that can be set with cgLegend. See the on-line documentation for a complete description of the keyword options available.
Here is an example of the plot with a background box and a single symbol for each item in the legend.
   cgPlot, cgDemoData(17), PSym=-15, Color='red', YRange=[0,140], $
       LineStyle=0, YStyle=1
   cgPlot, cgDemoData(17), PSym=-16, Color='dodger blue', /Overplot, $
       LineStyle=2
   cgLegend, Title=['Experiment 1', 'Experiment 2'], PSym=[-15,-16], $
       SymSize=2, Color=['red','dodger blue'], Location=[0.2, 0.85], $
       Length=0.0, VSpace=2.0, /Box, /Background, BG_Color='rose'
You see the results in the figure below.
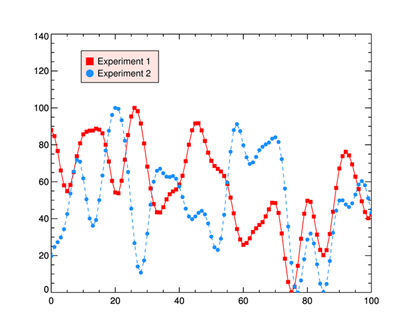 |
| A plot showing various options with cgLegend. |
Here is an example with a centered symbol and no background color in the box.
   cgPlot, cgDemoData(17), PSym=-15, Color='red', YRange=[0,140], $
       LineStyle=0, YStyle=1
   cgPlot, cgDemoData(17), PSym=-16, Color='dodger blue', /Overplot, $
       LineStyle=2
   cgLegend, Title=['Experiment 1', 'Experiment 2'], PSym=[-15,-16], $
       SymSize=2, Color=['red','dodger blue'], Location=[0.2, 0.85], $
       /Center_Sym, LineStyle=[0,2], VSpace=2.0, /Box
You see the results in the figure below.
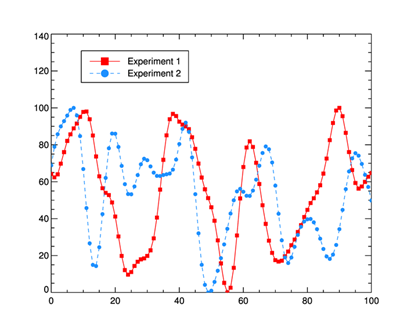 |
| A plot showing various options with cgLegend. |
![]()
Using the Alignment Keyword to Position the Legend
The Alignment keyword can be used in conjunction with the Location keyword to place and align the legend anywhere in the plot. The way it works is that you specify a point in the graphics window (inside or outside the plot, it doesn't matter) and you specify with the Alignment keyword which part of the legend "box" should be aligned with that point. You can align any of the four corners of the legend box, or you can align the middle of any of the four sides of the legend box. This allows you to center an align the legend box anywhere in the display window. To center the legend at the point (50,130) in the plot above, you would type this.
   cgPlot, cgDemoData(17), PSym=-15, Color='red', YRange=[0,140], $
       LineStyle=0, YStyle=1
   cgPlot, cgDemoData(17), PSym=-16, Color='dodger blue', /Overplot, $
       LineStyle=2
   cgLegend, Title=['Experiment 1', 'Experiment 2'], PSym=[-15,-16], $
       SymSize=2, Color=['red','dodger blue'], Location=[50,130], /Data, $
       /Center_Sym, LineStyle=[0,2], VSpace=2.0, /Box, Alignment=4
You see the results in the figure below.
 |
| Legend Centered about Location Point |
The Alignment values, shown below, modify the Location point like this.
   0 - Location specifies the upper left corner of the legend box.
   1 - Location specifies the upper right corner of the legend box.
   2 - Location specifies the lower right corner of the legend box.
   3 - Location specifies the lower left corner of the legend box.
   4 - Location specifies the top side of the legend box (centered horizontally).
   5 - Location specifies the bottom side of the legend box (centered horizontally).
   6 - Location specifies the left side of the legend box (centered vertically).
   7 - Location specifies the right side of the legend box (centered vertically).
   8 - Location specifies dead center of the legend box.
![]()
Version of IDL used to prepare this article: IDL 8.2.3.
This article has been written with financial support from David Platten and Mats Lafdahl.
![]()
![]()
Last Updated: 6 December 2013


