
Changing Plot Parameters
QUESTION: Once I have created a plot with several CGS commands in a cgWindow application, how can I change the plot parameters? Do I have to issue all of the commands over again?
![]()
ANSWER: Until the Coyote Graphics System (CGS) commands are turned into objects in version 2 of CGS, the answer to this question is "It depends."
In answering this question, I did find, however, that I had inadvertently switched the order of two parameters in the ReplaceCommand method in the cgWindow code. To make this example work, you need to have a version of the cgWindow program that you downloaded after May 6, 2011, in which this problem has been corrected. Otherwise, errors will be thrown when you try to replace a command in the window.
Suppose, for example, you had issued these commands to put a plot in a resizeable graphics window.
   data = cgDemoData(1)
   cgPlot, data, /Window
   cgPlotS, !X.CRange, [15,15], LineStyle=2, /Add
   cgPlotS, data, PSym=4, Color='red', /Add
You see the results in this figure.
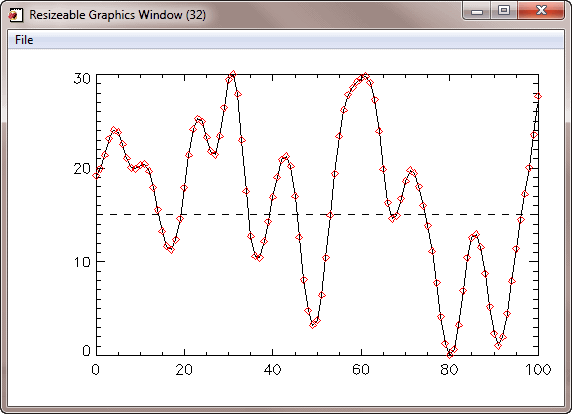 |
| A basic plot in a resizeable graphics window. |
The three commands are now stored in the window's command list. It is possible to replace any command in the command list. Suppose, for example, that you didn't want the symbols to be red, as shown, but dodger blue instead. You could replace the third command (command index number 2) in the command list with a new command, like this. The plot is updated immediately.
cgWindow, /ReplaceCmd, CmdIndex=2, 'cgPlotS', data, PSym=4, Color='dodger blue'
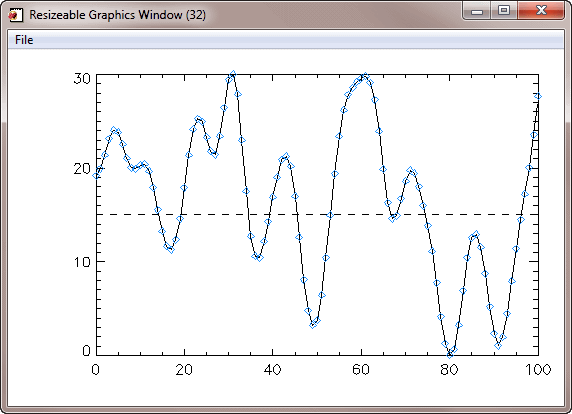 |
| The plot is immediately updated when the command is replaced. |
But, what if you wanted to change the range of the plot. Suppose, for example, you wanted to use the keyword XRange=[20,80] on the first cgPlot command. What would happen if you replaced that command?
You can try it with a command like this.
cgWindow, /ReplaceCmd, CmdIndex=0, 'cgPlot', data, XRange=[20,60]
You see the results in the following figure. As you can see, the plot is not exactly correct. The range is correct, but the dashed line and plot symbols are in the wrong place.
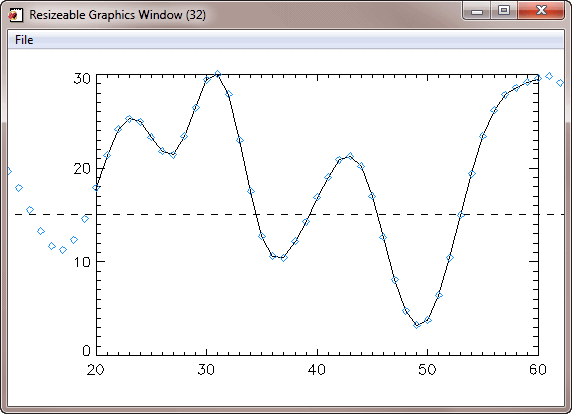 |
| The plot is not exactly correct when the first command is replaced. |
The reason for this has to do with the way the cgWindow stores its commands. Internally, for example, it stored the literal value of !X.CRange at the time the second command was added to the window. At that time, the literal value was the two element array [0,100]. When the commands in the command list are re-executed at some time later, it is not !X.CRange that is used in the second command, which should now have the value [20,80], but the actual value stored in the window from the original loading of the command. That is, the value [0,100]. Thus, the plot is incorrect.
In this particular case, you will have to reload the last two command, too. Plus, you will have to make sure the last command clips to the plot window. The commands will look like this.
   cgWindow, /ReplaceCmd, CmdIndex=1, 'cgPlotS', !X.CRange, [15,15], LineStyle=2
   cgWindow, /ReplaceCMD, CMDINDEX=2, 'cgPlotS', data, PSym=4, $
      Color='dodger blue', NoClip=0
This is probably too much work. It is probably much easier to just reissue the three commands and send them into the same cgWindow.
   cgPlot, data, XRange=[20,60], /Window
   cgPlotS, !X.CRange, [15,15], LineStyle=2, /Add
   cgPlotS, data, PSym=4, Color='dodger blue', NoClip=0, /Add
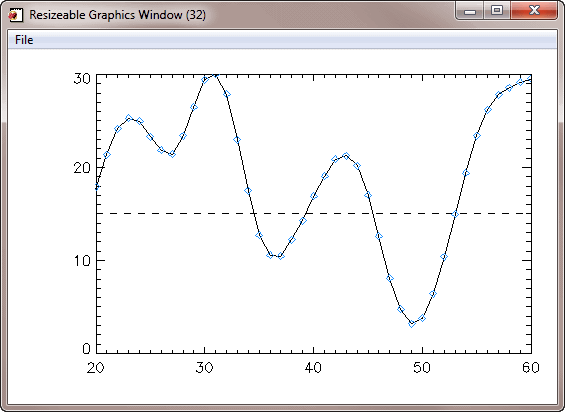 |
| It is probably easier to re-issue the commands than it is to replace them. |
![]()
Version of IDL used to prepare this article: IDL 7.0.1.
![]()
![]()


