
Output Contour Plot with Colorbar


QUESTION: I just want to make a high-quality PNG file of a contour plot with a color bar. I can easily create such a file with the contour plot, just by using the Output keyword to cgContour. But, I can't work out how to include the color bar in the file. What am I doing wrong?
Here is my code.
   cgDisplay, 600, 450
   data = cgDemoData(2)
   cgLoadCT, 33, NColors= 10, Bottom= 1
   c_colors= Indgen(10)+1
   position= [0.1, 0.1, 0.95, 0.825]
   cgContour, data, NLevels= 10, Label=1, /Fill, Position=position, $
      C_Colors=c_colors, /Outline ;;;; , OUTPUT='test.ps
   cgColorbar, Divisions=10, Range=[Min(data), Max(data)], /Discrete, $
            Position=[0.1, 0.91, 0.95, 0.94], NColors=10, Bottom=1
   ; I guess here is where I want to create a PNG file!!!
![]()
ANSWER: Yes, the Output keyword makes it very easy to get PostScript and raster output from individual Coyote Graphics commands. But, here you have multiple commands. When you have multiple commands, you are going to have to use a different strategy. One way to do it is to put the commands into a Coyote Graphics window (i.e., cgWindow) rather than into a normal IDL window (i.e., Window or cgDisplay).
The code should use the Output keyword available to cgWindow (via cgControl) to create the PNG file. Your code will look something like this.
   data = cgDemoData(2)
   cgLoadCT, 33, NColors= 10, Bottom= 1
   c_colors= Indgen(10)+1
   position= [0.1, 0.1, 0.95, 0.825]
   cgContour, data, NLevels= 10, Label=1, /Fill, Position=position, $
      C_Colors=c_colors, /Outline, WXSize=600, WYSize=450, /Window
   cgColorbar, Divisions=10, Range=[Min(data), Max(data)], /Discrete, $
      Position=[0.1, 0.91, 0.95, 0.94], NColors=10, Bottom=1, /AddCmd
   cgControl, Output='test.png'
You see the end result in the figure below.
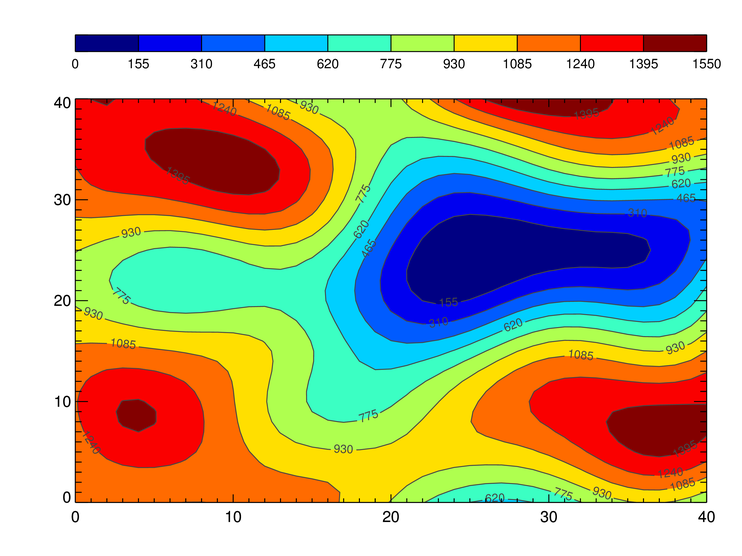 |
| The contour plot and color bar output as a PNG file. (ImageMagick, of course, has been installed to do the conversion from the intermediate PostScript file.) |
Another way to do this, which is how all the demonstration programs in the Coyote Plot Gallery work, is to write a wrapper program that can be sandwiched between calls to cgPS_Open and cgPS_Close, with the PNG keyword set on cgPS_Close.
For example, you create a program like this.
   PRO MyContour
      data = cgDemoData(2)
      cgLoadCT, 33, NColors= 10, Bottom= 1
      c_colors= Indgen(10)+1
      position= [0.1, 0.1, 0.95, 0.825]
      cgContour, data, NLevels= 10, Label=1, /Fill, Position=position, $
         C_Colors=c_colors, /Outline, WXSize=600, WYSize=450, /Window
      cgColorbar, Divisions=10, Range=[Min(data), Max(data)], /Discrete, $
         Position=[0.1, 0.91, 0.95, 0.94], NColors=10, Bottom=1, /AddCmd
   END
And you create a PNG file like this.
   IDL> cgPS_Open, 'test.ps'
   IDL> MyContour
   IDL> cgPS_Close, /PNG, /DELETE_PS
![]()
Version of IDL used to prepare this article: IDL 7.1.2.
![]()
![]()
Updated: 13 March 2013


