
Polar Wind Vector Plots


QUESTION: Mark Piper had a really nice visualization of polar wind vector plots from the Goddard Earth Observing System Model on his blog recently. But, he used the IDL 8 function graphics routines to write the program. I don't have IDL 8 yet. Can you show me how to create the same polar wind vector plots in Coyote Graphics?
Here is what Mark's plot looks like.
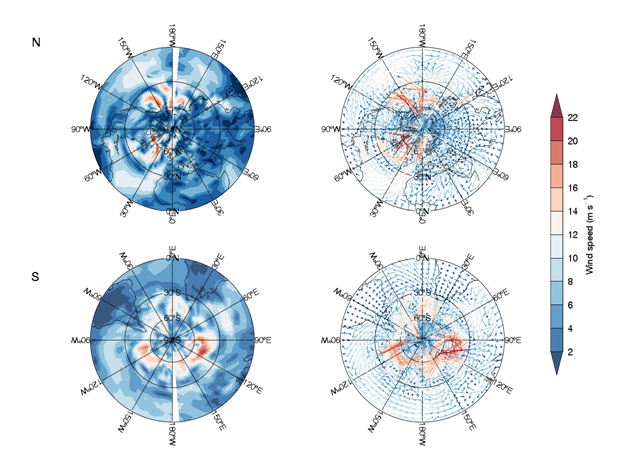 |
| Mark Piper's Polar Wind plot created with Function Graphics routines. |
![]()
ANSWER: Sure. Here is the same plot, written with Coyote Graphics routines.
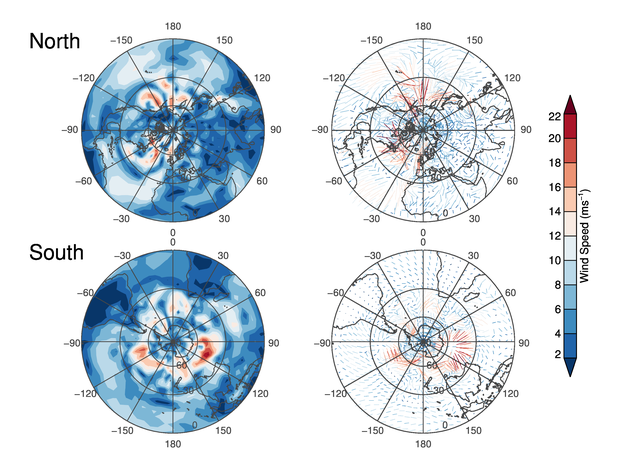 |
| The Polar Wind plot created with Coyote Graphics routines. |
You will need an up to date Coyote Library to run the program, as I had to add a Palette keyword to cgMapVector to color the vectors. I also had to fix a bug in cgMap_Grid.
I have had a hard time downloading data and program files from Mark's blog, so I have made the zip file Mark kindly supplied me with for this polar plot available here. You will need to unzip this file to get the data files necessary to run either of our programs.
You will find a couple of differences in the plots. Mark's plot has a slight gap in it, near the top of the plot, but I think this is because he doesn't wrap the longitudinal values back on themselves before he draws the contour plot. I think this is why Antarctica is missing in his plots, too.
The most obvious difference, probably, is that some of Mark's labels are upside down. I am not aware of a way to fix this in Function Graphics routines, but maybe it is possible.
One downside of Coyote Graphics routines is that I had to resort to some fancy maneuvering with the cgMap object to get the plot labels where I wanted them.
![]()
Version of IDL used to prepare this article: IDL 7.1.2.
![]()
![]()


