
Creating a Histogram with Logarithmic Bins
QUESTION: Can you show me how to create and plot a histogram with logarithmic bins? For example, I have two one-dimensional vectors and I'm interested in their ratio.
    v1 = Randomu(-3L, 1000) * 100     v2 = Randomu(-5L, 1000) * 100
    ratio = v1 / v2
Theoretically, ratio should be equally distributed in the range 0 to 1 and
in the range 1 to infinity. I would like to check this with a histogram
plot, using logarithmic bin sizes. Is this possible in IDL?
![]()
ANSWER: Yes, it is possible. The secret is to use Value_Locate to partition the data into your logarithmic bins. The code will look like this.
   bins = [0, 0.01, 0.1, 1.0, 10.0, 100.0, 1000.0]
   binnedRatio = Value_Locate(bins, ratio)
Note that the first positional parameter to Value_Locate must be sorted in monotonically increasing (or decreasing) order, but the second positional parameter does not have to be.
You can use cgHistoPlot to draw the histogram of the data. However, in this case, leave the X axis label off, since you will have to add your own labels later. Your code might look like this:
   cgHistoplot, binnedRatio, XTickformat='(A1)', /Fill
   labels = ['0', '0.01', '0.1', '1', '10', '100', '1000']
   FOR j=0,6 DO cgText, j, -30, labels[j], Alignment=0.5, Color='navy'
You see the results in the figure below. In this case, it looks like your theory is confirmed.
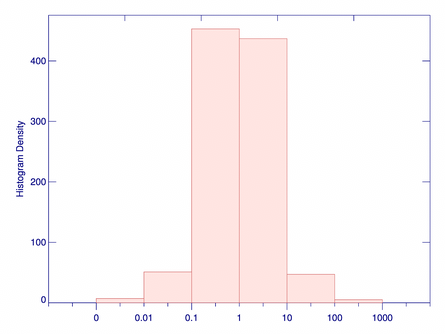 |
| A histogram plot with logarithmic bins. |
![]()
Version of IDL used to prepare this article: IDL 7.0.3.
![]()
Copyright © 2009 David W. Fanning
Last Updated 8 July 2009