
Adding a Colorbar
You can see many examples of plots with color bars of various sorts (along with the code to create them) in the Coyote Plot Gallery.
Suppose you wanted to add a horizontal color bar over the top of a contour plot. Here is one way (the hard way!) to do it.
First, load some colors. Let's suppose you want 200 colors.
   cgLoadCT, 5, NColors=200
   ncolors = 200
Next, leave some space at the top of your contour plot for the color bar with the POSITION keyword. Like this:
   cgContour, Dist(31, 41), NLevels=25, $
      C_Colors=Indgen(25)*8, Position=[0.15, 0.15, 0.95, 0.8]
Now, suppose you want the color bar to be the length of the contour plot, and positioned above it. You might specify its location like this:
loc = [0.15, 0.80, 0.95, 0.90]
I like to position my color bars in the graphics window with normalized coordinates, so that they go into any sized window. (Most of my graphics windows are resizeable these days.)
Now create a color bar. (For a vertical bar exchange the two expressions on either side of the matrix multiplier.)
bar = Bindgen(256) # Replicate(1B, 10)
Scale the color bar to the number of colors you are using.
bar = BytScl(bar, Top=ncolors-1)
Display the color bar in the window. This will be slightly different depending upon whether you are outputting to PostScript or not. My code usually looks like this,
cgImage, bar, Position=loc
Draw a box around the bar.
   cgPlotS, [loc(0), loc(0), loc(2), loc(2), loc(0)], $
       [loc(1), loc(3), loc(3), loc(1), loc(1)], /Normal
Now, you can add annotations to the bar as needed. Many people use cgText. I like to use the cgPlot command to label the color bar because this gives me tick marks, nice labels, etc. For example, instead of the cgPlotS command above, I would use the cgPlot command.
   cgPlot, [0,1], [0,1], /NoData, /NoErase, Position=loc, $
     XRange=[0,256], XTicks=8, YTickFormat='(A1)', YTicks=1, $
     YMinor=0, XTicklen=0.25, XMinor=0, XStyle=1, YStyle=1, $
     Title='Simple Color Bar'
Here is what the simple color bar described above looks like.
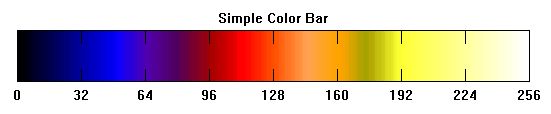 |
| A simple color bar. |
Using cgColorbar To Produce Color Bars
It is considerably easier to use the Coyote Library routine cgColorbar to create your color bars, because of its flexibility and it's numerous features. The basic color bar can be created by simply loading a color table and calling the cgColorbar program.
   cgLoadCT, 33
   cgColorbar
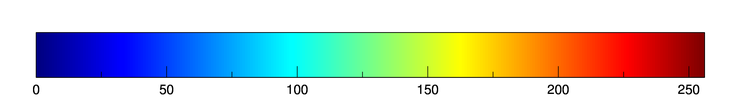 |
| The most basic color bar. |
You can add features like specifying the number of divisions in the color bar, the number of minor tick marks, and how you would like the color bar to be labelled.
   cgErase
   cgColorbar, Divisions=4, Minor=5, Format='(F0.2)'
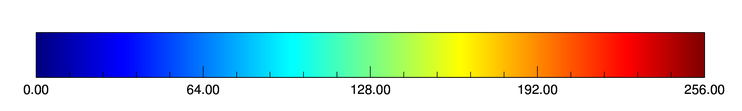 |
| Adding features to the color bar. |
You could do the same thing, but put the ticks outside and on top of the color bar.
   cgErase
   cgColorbar, Divisions=4, Minor=5, Format='(F0.2)', Ticklen=-0.25, /Top
 |
| Color bar annotations on top with outward facing ticks. |
You can put out-of-bounds color triangles on color bars. These are independent, so you have one or both or none of the out-of-bounds triangles. Is this example, you see both of the out-of-bounds triangles added. We also set the data range of the color bar with the Range keyword. The out-of-bounds colors can be set with the name of a color, and index into the current color table, or a color triple.
   cgErase
   cgColorbar, Divisions=4, Minor=5, Format='(F0.2)', Range=[-100, 100], $
       OOB_Low='rose', OOB_High='charcoal'
 |
| A color bar with out-of-bounds colors and the range set with the Range keyword. |
It is often the case that you want to limit the color bar to a handful of colors. This is often done, for example, when you are working with filled contour plots. In such situations, the Discrete keyword is often helpful.
   cgErase
   cgLoadCT, 33, NColors=8, Bottom=1
   cgColorbar, NColors=8, Bottom=1, /Discrete, Range=[-100,100]
 |
| A discrete color bar with eight colors. |
If may be you prefer a different type of discrete color bar. If so, the cgDCBar program is available. Here is how this program looks, displaying colors for the 12 months.
   cgErase
   cgLoadCT, 33, NColors=12, Bottom=1
   cgDCBar, NColors=12, Bottom=1, Labels=cgMonths(/Abbreviation)
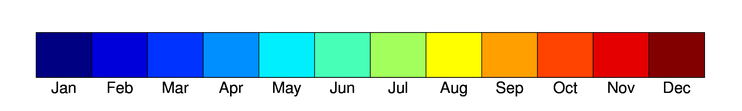 |
| A different discrete color table with cgDCBar. |
![]()
Written 8 January 2006
Last Updated 9 December 2011


