
Gridded Contour Plots on Map Projections
QUESTION: Can you help me remove this gap in my filled contour plot? I have randomly sampled data that I have saved in an IDL save file. The three variables, data, lon, and lat, represent the Kelvin temperature, and the longitude the latitude of each sampling location. I would like to display this data as a filled contour plot on an orthographic map projection.
Here is the code I am using to produce the plot. I realize I have to grid the data, so I am creating the set of Delaunay triangles for the gridding with the Triangulate procedure, and passing the resulting triangles to cgContour with the Triangulation keyword. But look at the the large gray area in the figure at the international date line. How can I remove this gap or band from the image?
   Restore, "griddedfillcontour.sav"
   Triangulate, lon, lat, triangles, /DEGREES
   cgDisplay, COLOR='gray', 400, 400, WID=1, TITLE='Problem Plot'
   Map_Set, /ORTHOGRAPHIC, 90, 30, 65, /NOERASE, /ISOTROPIC, $
     POSITION=[0.05, 0.05, 0.95, 0.95], /NOBORDER
   nlevels=10
   cgLoadCT, 4, NCOLORS=nlevels+1, BOTTOM=1, /BREWER, /REVERSE
   minlev = Float(Round(Min(data)))
   maxlev = Float(Round(Max(data)))
   levels = Indgen(nlevels+1) * ((maxlev - minlev) / nlevels) + minlev
   cgContour, data, lon, lat, /OVERPLOT, /CELL_FILL, LEVELS=levels, $
      C_COLORS=Indgen(nlevels)+1, TRIANGULATION=triangles
   cgContour, data, lon, lat, /OVERPLOT, LEVELS=levels, $
      CHARSIZE=1.0, TRIANGULATION=triangles
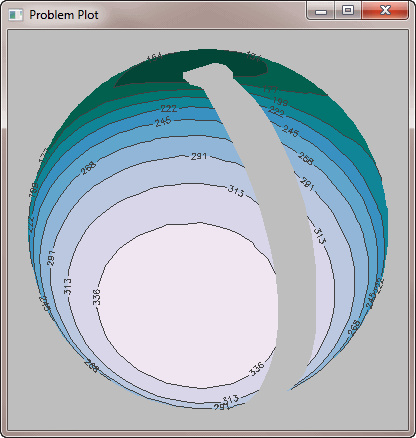 |
| This is the result of passing the data to Triangulate to create the Delaunay triangles, then passing those triangles to the cgContour command. |
![]()
ANSWER: The problem here is the way you are gridding your data. Note that another way to grid the data is to pass the data as is, and set the Irregular keyword. In this case, however, the problem gets even worse.
   cgDisplay, COLOR='gray', 400, 400, WID=3, TITLE='Another Gridding Problem'
   Map_Set, /ORTHOGRAPHIC, 30,150, /NOERASE, /ISOTROPIC, $
     POSITION=[0.05, 0.05, 0.95, 0.95], /NOBORDER
   nlevels=10
   cgLoadCT, 4, NCOLORS=nlevels+1, BOTTOM=1, /BREWER, /REVERSE
   minlev = Float(Round(Min(data)))
   maxlev = Float(Round(Max(data)))
   levels = Indgen(nlevels) * ((maxlev - minlev) / nlevels) + minlev
   cgContour, data, lon, lat, /OVERPLOT, /CELL_FILL, LEVELS=levels, $
      C_COLORS=Indgen(nlevels)+1, /IRREGULAR
   cgContour, data, lon, lat, /OVERPLOT, LEVELS=levels, CHARSIZE=1.0, /IRREGULAR
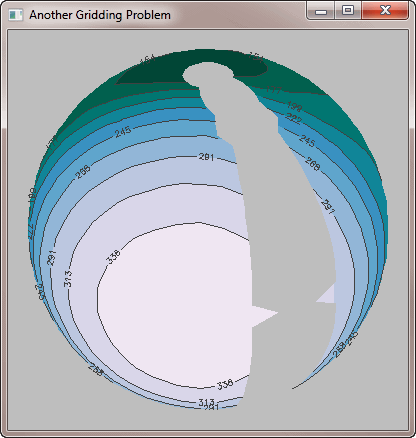 |
| In this figure the contour command itself is asked to do
the gridding of the data (by setting the Irregular keyword). This is even worse than the original result. |
In fact, you are going to have to grid the data yourself with Triangulate and Trigrid, but you have to be careful how you do this. For example, you might think to use a standard, linear grid, like this. As you can see, this doesn't solve the problem.
   Triangulate, lon, lat, triangles, /DEGREES
   gridded = Trigrid(lon, lat, data, triangles, [0.25,0.25], [-180, -90, 180, 90], $
      XGRID=x, YGRID=y, /DEGREES)
   cgDisplay, COLOR='gray', 400, 400, WID=4, TITLE='Flat Gridding Plot'
   Map_Set, /ORTHOGRAPHIC, 30,150, /NOERASE, /ISOTROPIC, $
     POSITION=[0.05, 0.05, 0.95, 0.95], /NOBORDER
   nlevels=10
   cgLoadCT, 4, NCOLORS=nlevels+1, BOTTOM=1, /BREWER, /REVERSE
   minlev = Float(Round(Min(data)))
   maxlev = Float(Round(Max(data)))
   levels = Indgen(nlevels) * ((maxlev - minlev) / nlevels) + minlev
   cgContour, gridded, x, y, /OVERPLOT, /CELL_FILL, LEVELS=levels, $
      C_COLORS=Indgen(nlevels)+1
   cgContour, gridded, x, y, /OVERPLOT, LEVELS=levels, CHARSIZE=1.0
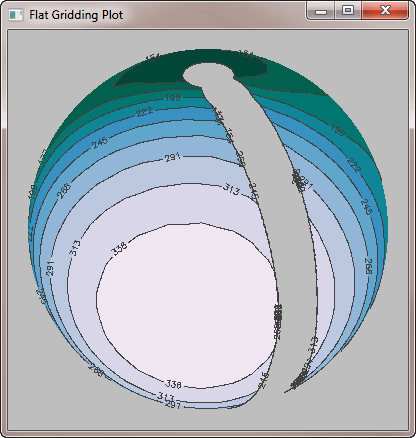 |
| A linear grid doesn't solve the problem either. |
The solution to this problem is to use Triangulate and Trigrid, but to use them to perform spherical gridding of the data. Here is the proper solution.
   Triangulate, lon, lat, /DEGREES, SPHERE=sTriangles, FVALUE=data
   gridded = Trigrid(data, [0.25,0.25], [-180, -90, 180, 90], $
      SPHERE=sTriangles, XGRID=x, YGRID=y, /DEGREES)
   cgDisplay, COLOR='gray', 400, 400, WID=2, TITLE='Solution Plot'
   Map_Set, /ORTHOGRAPHIC, 30,150, /NOERASE, /ISOTROPIC, $
     POSITION=[0.05, 0.05, 0.95, 0.95], /NOBORDER
   nlevels=10
   cgLoadCT, 4, NCOLORS=nlevels+1, BOTTOM=1, /BREWER, /REVERSE
   minlev = Float(Round(Min(data)))
   maxlev = Float(Round(Max(data)))
   levels = Indgen(nlevels) * ((maxlev - minlev) / nlevels) + minlev
   cgContour, gridded, x, y, /OVERPLOT, /CELL_FILL, LEVELS=levels, $
      C_COLORS=Indgen(nlevels)+1
   cgContour, gridded, x, y, /OVERPLOT, LEVELS=levels, CHARSIZE=1.0
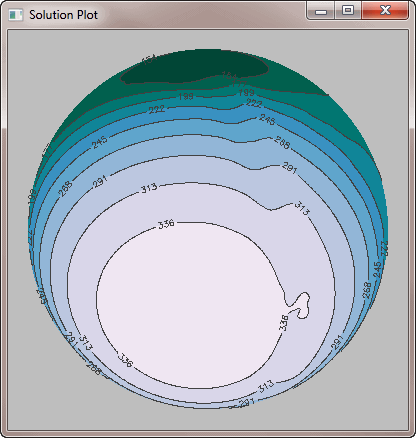 |
| Spherical gridding is the solution to this problem. |
Importance of the Cell_Fill Keyword
Please note how important it is to use the Cell_Fill keyword when overplotting a filled contour plot onto a map projection. Here is the same code that produced the correct plot above, but with the Fill keyword substituted for the Cell_Fill keyword. You see immediately how the Fill keyword results in incorrect colors being used and confused filling of contour levels. Always use the Cell_Fill keyword when using filled contour plots with map projections.
   Triangulate, lon, lat, /DEGREES, SPHERE=sTriangles, FVALUE=data
   gridded = Trigrid(data, [0.25,0.25], [-180, -90, 180, 90], $
      SPHERE=sTriangles, XGRID=x, YGRID=y, /DEGREES)
   cgDisplay, COLOR='gray', 400, 400, WID=2, TITLE='Fill Keyword Plot'
   Map_Set, /ORTHOGRAPHIC, 30,150, /NOERASE, /ISOTROPIC, $
     POSITION=[0.05, 0.05, 0.95, 0.95], /NOBORDER
   nlevels=10
   cgLoadCT, 4, NCOLORS=nlevels+1, BOTTOM=1, /BREWER, /REVERSE
   minlev = Float(Round(Min(data)))
   maxlev = Float(Round(Max(data)))
   levels = Indgen(nlevels) * ((maxlev - minlev) / nlevels) + minlev
   cgContour, gridded, x, y, /OVERPLOT, /FILL, LEVELS=levels, $
      C_COLORS=Indgen(nlevels)+1
   cgContour, gridded, x, y, /OVERPLOT, LEVELS=levels, CHARSIZE=1.0
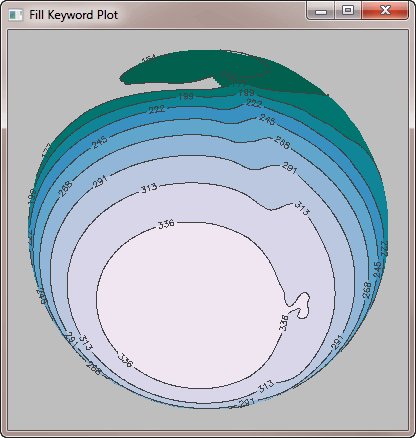 |
| Even spherical gridding can't solve the problem if the wrong Fill keyword is used with the contour command. |
![]()
Version of IDL used to prepare this article: IDL 7.0.1.
![]()
![]()


