
Choosing the Y Range in IDL
QUESTION: Yikes! When I set the XRANGE keyword on my Plot command, the YRANGE is changed to something completely wrong. Is this a bug in IDL?
Let me show you what I mean.
   IDL> x = [-0.96062616, 21.975719]
   IDL> y = [0,14.7]
   IDL> cgWindow, WXSize=500, WYSize=350
   IDL> cgPlot, x, y, /Add
This plot is perfectly normal, as you can see in the figure.
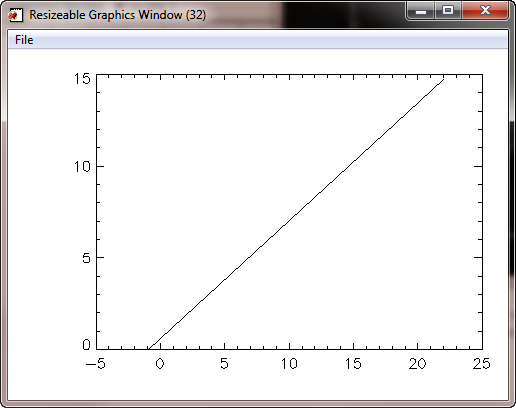 |
| The data is plotted normally. |
But, if I set the XRANGE, look what happens to the Y axis!
IDL> cgPlot, x, y, XRANGE=[0,15], /Add
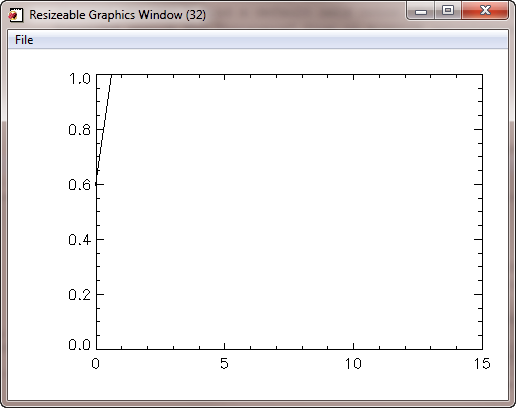 |
| The Y axis is changed by setting the XRANGE keyword! |
![]()
ANSWER: Yes, this certainly looks like a bug, but it isn't. Rather, it has to do with how IDL determines the default Y range.
To determine the Y range of a plot, IDL examines the Y values that are associated with the X values in the specified X range. It sets the Y range in accordance with the minimum and maximum Y values in this sub-sample of the data. In this particular example, there are no X values in this range and, thus, no Y values! Faced with this fact, IDL resorts to creating a default Y axis with a "normalized" Y range of 0 to 1.
You can work around this problem by simply setting the Y range yourself, with the YRANGE keyword.
IDL> cgPlot, x, y, XRANGE=[0,15], YRANGE=y, /Add
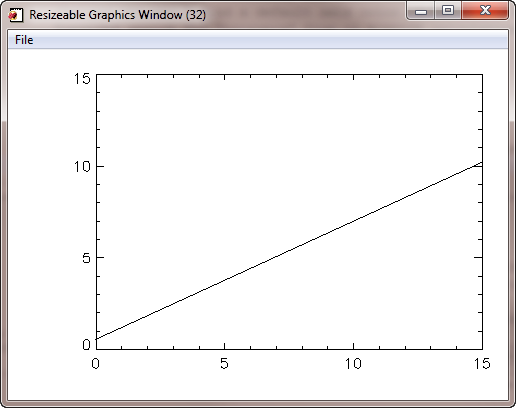 |
| The correct plot is obtained by also setting the Y range. |
![]()
Version of IDL used to prepare this article: IDL 7.0.1.
![]()
![]()


