.\
cgbarplot.pro
top cgBarPlot
Graphics
cgBarPlot, values [, /ADDCMD] [, AXISCOLOR=string/integer] [, BACKGROUND=string/integer] [, BARCOORDS=float] [, BARNAMES=string] [, BAROFFSET=float] [, BARSPACE=float] [, BARTHICK=float] [, BARWIDTH=float] [, BASELINES=float] [, BASERANGE=float] [, COLORS=varies] [, LABELSKIP=integer] [, LAYOUT=intarr(3)] [, /NOERASE] [, OUTFILENAME=string] [, /OUTLINE] [, OUTPUT=string] [, OPLOTCOLORS=varies] [, /OVERPLOT] [, POSITION=fltarr(4)], RANGE=RANGE [, /ROTATE] [, TITLE=string] [, /WINDOW] [, /XSTYLE] [, XTITLE=string] [, /YSTYLE] [, YTITLE=string] [, _REF_EXTRA=any]
Provides a device-independent and color-model-independent way to create a bar plot or to overplot on an existing bar plot.
The program requires the Coyote Library to be installed on your machine.
Parameters
- values in required
A vector containing the values to be represented by bars. Each element in the vector will be represented by a bar.
Keywords
- ADDCMD in optional type=boolean default=0
Set this keyword to add the command to a cgWindow resizeable graphics window.
- AXISCOLOR in optional type=string/integer default=black
If this keyword is a string, the name of the axis color. By default, 'black'. Otherwise, the keyword is assumed to be a color index into the current color table.
- BACKGROUND in optional type=string/integer default=white
If this keyword is a string, the name of the background color. By default, 'white'. Otherwise, the keyword is assumed to be a color index into the current color table.
- BARCOORDS out optional type=float
A vector of values for the center point of the bars.
- BARNAMES in optional type=string
A string array, containing one string label per bar. If the bars are vertical, the labels are placed beneath them. If horizontal (rotated) bars are specified, the labels are placed to the left of the bars.
- BAROFFSET in optional type=float default=barspace/barwidth*1.5
A scalar that specifies the offset to be applied to the first bar, in units of "nominal bar width". This keyword allows, for example, different groups of bars to be overplotted on the same graph.
- BARSPACE in optional type=float default=barwidth*0.20
A scalar that specifies, in units of "nominal bar width", the spacing between bars. For example, if BARSPACE is 1.0, then all bars will have one bar-width of space between them. If not specified, the bars are spaced apart by 20% of the bar width.
- BARTHICK in optional type=float default=1.0
A scalar that specifies the thickness of the bar outlines.
- BARWIDTH in optional type=float
A floating-point value that specifies the width of the bars in units of "nominal bar width". The nominal bar width is computed so that all the bars (and the space between them will fill the available space (optionally controlled with the BASERANGE keyword).
- BASELINES in optional type=float default=0.0
A vector, the same size as VALUES, that contains the base value associated with each bar. If not specified, a base value of zero is used for all bars.
- BASERANGE in optional type=float default=1.0
A floating-point scalar in the range 0.0 to 1.0, that determines the fraction of the total available plotting area (in the direction perpendicular to the bars) to be used. If not specified, the full available area is used.
- COLORS in optional type=varies
A vector of color values, the same size as VALUES, containing either the color names, 24-bit color values, or color index numbers (byte values) of the colors to be used for the bars. If not specified, the colors are selected based on the available colors in the current color table.
- LABELSKIP in optional type=integer default=1
Normally, every bar is labelled. IDL has a maximum number of 60 labels. This keyword allows you to control how bars are labelled and to work around the 60 label limit. Set this keyword the number of labels to skip. For example, if you had 90 bars, you could set Labelskip=3 and have 30 labels. If undefined, Labelskip will always be set so there are less than 60 labels on the plot.
- LAYOUT in optional type=intarr(3)
This keyword specifies a grid with a graphics window and determines where the graphic should appear. The syntax of LAYOUT is three numbers: [ncolumns, nrows, location]. The grid is determined by the number of columns (ncolumns) by the number of rows (nrows). The location of the graphic is determined by the third number. The grid numbering starts in the upper left (1) and goes sequentually by column and then by row.
- NOERASE in optional type=boolean default=0
Set this keyword to draw the plot without erasing the display first.
- OUTFILENAME in optional type=string
If the
Outputkeyword is set, the user will be asked to supply an output filename, unless this keyword is set to a non-null string. In that case, the value of this keyword will be used as the filename and there will be no dialog presented to the user.- OUTLINE in optional type=boolean default=0
Set this keyword to draw an outline around each bar in the OPLOTCOLORS.
- OUTPUT in optional type=string
Set this keyword to the type of output desired. Possible values are these:
Or, you can simply set this keyword to the name of the output file, and the type of file desired will be determined by the file extension. If you use this option, the user will not be prompted to supply the name of the output file.'PS' - PostScript file 'EPS' - Encapsulated PostScript file 'PDF' - PDF file 'BMP' - BMP raster file 'GIF' - GIF raster file 'JPEG' - JPEG raster file 'PNG' - PNG raster file 'TIFF' - TIFF raster fileAll raster file output is created through PostScript intermediate files (the PostScript files will be deleted), so ImageMagick and Ghostview MUST be installed to produce anything other than PostScript output. (See cgPS2PDF and cgPS_Close for details.) And also note that you should NOT use this keyword when doing multiple plots. The keyword is to be used as a convenient way to get PostScript or raster output for a single graphics command. Output parameters can be set with cgWindow_SetDefs.
- OPLOTCOLORS in optional type=varies default=charcoal
A vector of color values, similar to colors for overplot outlines on the bars. If a scalar value (e.g., "charcoal") the same value is used for all outlines.
- OVERPLOT in optional type=boolean default=0
Set this keyword if you wish to overplot data on an already exisiting set of axes. It is like calling the IDL OPLOT command.
- POSITION in optional type=fltarr(4)
The usual four-element normalized position vector for the Plot comamnd.
- RANGE
- ROTATE in optional type=boolean default=0
If set, this keyword indicates that horizontal rather than vertical bars should be drawn. The bases of horizontal bars are on the left, "Y" axis and the bars extend to the right.
- TITLE in optional type=string
The title of the plot, if supplied.
- WINDOW in optional type=boolean default=0
Set this keyword if you want to display the plot in a resizable graphics window.
- XSTYLE in optional type=boolean default=1
The normal XSTYLE keyword. See "Graphics Keywords" in on-line help.
- XTITLE in optional type=string
The X title of the plot, if supplied.
- YSTYLE in optional type=boolean default=1
The normal YSTYLE keyword. See "Graphics Keywords" in on-line help.
- YTITLE in optional type=string
The Y title of the plot, if supplied.
- _REF_EXTRA in optional type=any
Any keyword appropriate for the IDL Plot command is allowed in the program.
Examples
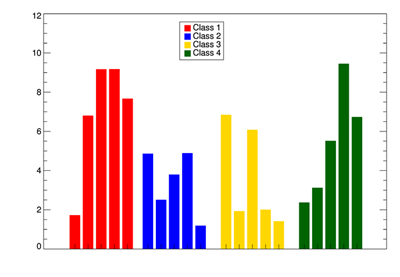
To create bar plots of four different bar classes. Example uses AL_Legend from the NASA Astronomy Library. Comment out if not available.:
  seed = -5L
  data1 = RandomU(seed, 5) * 10.0
  data2 = RandomU(seed, 5) * 7.5
  data3 = RandomU(seed, 5) * 7.5
  data4 = RandomU(seed, 5) * 10.0
  !P.Multi=[0,2,2]
  cgDisplay, WID=0
  cgBarPlot, data1, /OUTLINE, OPLOTCOLOR='charcoal', YRANGE=[0, 12], COLORS='red', XTITLE='Class 1'
  cgBarPlot, data2, /OUTLINE, OPLOTCOLOR='charcoal', YRANGE=[0, 12], COLORS='blue', XTITLE='Class 2'
  cgBarPlot, data3, /OUTLINE, OPLOTCOLOR='charcoal', YRANGE=[0, 12], COLORS='gold', XTITLE='Class 3'
  cgBarPlot, data4, /OUTLINE, OPLOTCOLOR='charcoal', YRANGE=[0, 12], COLORS='dark green', XTITLE='Class 4'
  !P.Multi=0
  cgDisplay, WID=1
  barnames = ['Exp 1', 'Exp 2', 'Exp 3', 'Exp 4', 'Exp 5']
  cgBarPlot, data1, YRANGE=[0, 35], COLORS='red', BARNAMES=barnames
  cgBarplot, data2, /OVERPLOT, BASELINE=data1, COLORS='blue'
  cgBarplot, data3, /OVERPLOT, BASELINE=data1+data2, COLORS='gold'
  cgBarplot, data4, /OVERPLOT, BASELINE=data1+data2+data3, COLORS='dark green'
  colors = ['red', 'blue', 'gold', 'dark green']
  items = ['Class 1', 'Class 2', 'Class 3', 'Class 4']
  Al_Legend, items, /FILL, PSYM=Replicate(15,4), COLORS=colors, SYMSIZE=Replicate(1.75,4), $
      POSITION=[0.20, 0.92], /NORMAL, CHARSIZE=cgDefCharSize()
  cgDisplay, WID=2
  cgBarPlot, data1, YRANGE=[0, 12], BAROFFSET=2.5, BASERANGE=0.20, COLORS='red'
  cgBarplot, data2, /OVERPLOT, BAROFFSET=9.5, BASERANGE=0.20, COLORS='blue'
  cgBarplot, data3, /OVERPLOT, BAROFFSET=17.0, BASERANGE=0.20, COLORS='gold'
  cgBarplot, data4, /OVERPLOT, BAROFFSET=24.5, BASERANGE=0.20, COLORS='dark green'
  colors = ['red', 'blue', 'gold', 'dark green']
  items = ['Class 1', 'Class 2', 'Class 3', 'Class 4']
  Al_Legend, items, /FILL, PSYM=Replicate(15,4), COLORS=colors, SYMSIZE=Replicate(1.75,4), $
      POSITION=[0.45, 0.92], /NORMAL, CHARSIZE=cgDefCharSize()
Author information
- Author:
FANNING SOFTWARE CONSULTING:
David W. Fanning 1645 Sheely Drive Fort Collins, CO 80526 USA Phone: 970-221-0438 E-mail: david@idlcoyote.com Coyote's Guide to IDL Programming: http://www.idlcoyote.com- Copyright:
Copyright (c) 2011-2014, Fanning Software Consulting, Inc.
- History:
Change History:
  Written, 3 October 2011. DWF. Written as a straight-forward translation of
      the IDL Bar_Plot program. In retrospect, maybe not the best idea, as I
      don't think the Bar_Plot program actually works and the interface is clunky.
      But, this is a start. The interface may change to something more elegant over
      time.
   Updated the BACKGROUND color selection from lessons learned in 27 Oct 2011 cgContour
       corrections. 27 Oct 2011. DWF.
   Added the ability to send the output directly to a file via the OUTPUT keyword. 9 Dec 2011, DWF.
   PostScript, PDF, and Imagemagick parameters can now be tailored with cgWindow_SetDefs. 14 Dec 2001. DWF.
   Modified to use cgDefaultColor for default color selection. 24 Dec 2011. DWF.
   Fixed a problem with keyword inheritance. Added XStyle and YStyle keywords. 25 Jan 2012. DWF.
   Added BARCOORDS keyword to return bar plot locations. 25 Jan 2012.
   Changes to allow better default colors, based on changes to cgColor and cgDefaultColor. 1 Feb 2012. DWF.
   Small problem with setting range keywords and with extraneous marks on the bar plot axis fixed. 6 Feb 2012. DWF.
   Added the ability to use escape characters in plot titles to specify cgSymbol symbols. 27 July 2012. DWF.
   Fixed a typo that was interfering with the YTITLE keyword. 3 Oct 2012. DWF.
   Fixed a bug in the interaction of the NOERASE and OVERPLOT keywords. 14 Jan 2013. DWF.
   Added a BARTHICK keyword to change the thickness of the bar outlines. 28 Feb 2013. DWF.
   Further work checking for NANs in the display of the data. NAN data set to length of 0. 3 Sept 2013. DWF.
   Added LABELSKIP keyword and make sure number of labels doesn't exceed 60. 8 Feb 2014. DWF.
   Somehow the BARCOORDS coordinates have gone on walk-about. Restored. 15 April 2014. DWF.
File attributes
| Modification date: | Fri Mar 27 11:07:37 2015 |
| Lines: | 708 |
| Docformat: | rst rst |