.\
cgdotplot.pro
top cgDotPlot
Graphics
cgDotPlot, labels, values [, /ADDCMD] [, AXISCOLOR=string/integer] [, BACKGROUND=string/integer] [, CHARSIZE=float] [, COLOR=string/integer] [, FONT=integer] [, LABELCHARSIZE=float] [, LABELCOLOR=string] [, /NOGRID] [, /NOERASE] [, OUTPUT=string] [, /OVERPLOT] [, POSITION=vector] [, PSYM=integer] [, PLOTFILLCOLOR=string] [, SYMSIZE=float] [, TITLE=string] [, XCHARSIZE=float] [, XGRIDSTYLE=integer] [, XRANGE=XRANGE] [, XSTYLE=XSTYLE] [, XTITLE=string] [, YGRIDSTYLE=integer] [, /WINDOW]
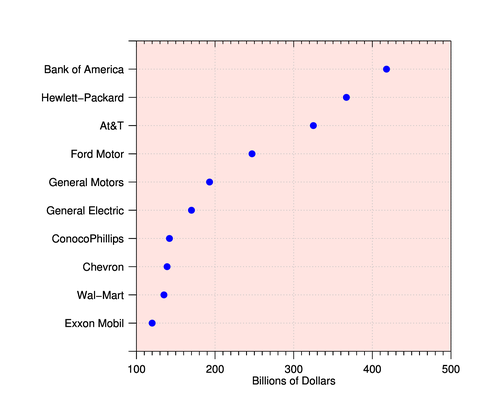
The purpose of cgDotPlot is to create a "dot plot" of the sort described on this web page.
Parameters
- labels in required type=strarr
A vector of string labels to be plotted along the left edge of the dot plot.
- values in required
A vector of values associated with each label, representing the values to be plotted on the dot plot.
Keywords
- ADDCMD in optional type=boolean default=0
Set this keyword to add the command to the resizeable graphics window cgWindow.
- AXISCOLOR in optional type=string/integer default=opposite
If this keyword is a string, the name of the axis color. Otherwise, the keyword is assumed to be a color index into the current color table.
- BACKGROUND in optional type=string/integer default=WHITE
If this keyword is a string, the name of the background color. Otherwise, the keyword is assumed to be a color index into the current color table.
- CHARSIZE in optional type=float
The character size for axes annotations. Uses cgDefCharSize to select default character size, unless !P.Charsize is set, in which case !P.Charsize is always used.
- COLOR in optional type=string/integer default=BLACK
If this keyword is a string, the name of the data color. Color names are those used with cgColor. Otherwise, the keyword is assumed to be a color index into the current color table.
- FONT in optional type=integer default=!P.Font
The type of font desired for axis annotation.
- LABELCHARSIZE in optional type=float
The character size of the labels. The default is to use
Charsize.- LABELCOLOR in optional type=string
The name of the color the labels should be drawn in. The default is the
AxisColor.- NOGRID in optional type=boolean default=0
Set this keyword to eliminate the background grid from the plot.
- NOERASE in optional type=boolean default=0
Set this keyword to draw the plot without erasing the display first.
- OUTPUT in optional type=string
Set this keyword to the name of an output file. The type of file is determined from the file's extension, as listed below. Normally, the file name is given in all lowercase letters:
All raster file output is created through PostScript intermediate files (the PostScript files will be deleted), so ImageMagick and Ghostview MUST be installed to produce anything other than PostScript output. (See cgPS2PDF and cgPS_Close for details.) And also note that you should NOT use this keyword when doing multiple plots. The keyword is to be used as a convenient way to get PostScript or raster output for a single graphics command. Output parameters can be set with'ps' - PostScript file 'eps' - Encapsulated PostScript file 'pdf' - PDF file 'bmp' - BMP raster file 'gif' - GIF raster file 'jpg' - JPEG raster file 'png' - PNG raster file 'tif' - TIFF raster filecgWindow_SetDefs.- OVERPLOT in optional type=boolean default=0
Set this keyword if you wish to overplot data on an already exisiting set of cgDotPlot axes. Note that labels will have to be passed, but they will not be drawn again in the overplotting.
- POSITION in optional type=vector
The usual four-element position vector for the Plot comamnd. Only monitored and possibly set if the
Aspectkeyword is used.- PSYM in optional type=integer
Any normal IDL PSYM values, plus any value supported by the Coyote Library routine cgSYMCAT. An integer between 0 and 46. This may also be set to the "name" of a symbol, such as returned from Print, cgSymCat(/Names).
- PLOTFILLCOLOR in optional type=string default=BLK1
The name of the color that fills the area inside the axes on the plot.
- SYMSIZE in optional type=float default=1.0
The symbol size.
- TITLE in optional type=string
The title of the plot.
- XCHARSIZE in optional type=float
The character size of the annotations on the X axis of the plot.
- XGRIDSTYLE in optional type=integer default=1
The X line style of the grid lines used to draw the grid on the axis. By default, dots.
- XRANGE in optional
A two-element array giving the X range of the plot.
- XSTYLE in optional
A two-element array giving the X style of the plot. Normally, this is set to 1 to give exact axis ranges. Otherwise, not used.
- XTITLE in optional type=string
The X title of the plot.
- YGRIDSTYLE in optional type=integer default=1
The Y line style of the grid lines used to draw the grid on the axis. By default, dots.
- WINDOW in optional type=boolean default=0
Set this keyword to replace all the commands in a current cgWindow or to create a new cgWindow for displaying this command.
Examples
There are several examples in a main-level program at the end of this program file.
Author information
- Author:
FANNING SOFTWARE CONSULTING:
David W. Fanning 1645 Sheely Drive Fort Collins, CO 80526 USA Phone: 970-221-0438 E-mail: david@idlcoyote.com Coyote's Guide to IDL Programming: http://www.idlcoyote.com- Copyright:
Copyright (c) 2012, Fanning Software Consulting, Inc.
- History:
Change History:
  Written, 12 November 2012, by David W. Fanning and donated to the IDL community
      by Marta Yebra of CSIRO, Australia.
File attributes
| Modification date: | Fri Mar 27 11:07:38 2015 |
| Lines: | 521 |
| Docformat: | rst rst |