
Shapefiles Gone Berserk
QUESTION: OK, I laid out big bucks for your Coyote Graphics mapping software (well, OK, a couple of beers worth), and so far its been a huge disappointment. The first thing I tried was to draw a shapefile, and all hell broke lose. Lines going everywhere! IDL nearly fell to its knees. What do you have to say for yourself?
Here is what I tried.
   cgDisplay, 800, 800
   cgMap_Set, 52, 13, 0.0, /Azimuthal, Limit=[52.3, 13.0, 52.7, 13.8]
   shapefile = 'Bezirksregion_EPSG_25833.shp'
   cgDrawShapes, shapefile
   cgMap_Grid, /Box_Axes, Color='charcoal'
I get a ton of these messages.
   % PLOTS: Value of Latitude is out of allowed range.
   % PLOTS: Value of Latitude is out of allowed range.
   % PLOTS: Value of Latitude is out of allowed range.
   % PLOTS: Value of Latitude is out of allowed range.
And here is what the plot looks like.
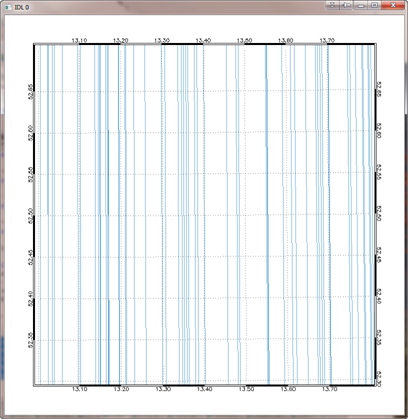 |
| Shapefile goes berserk! |
Can't you write better software than that!?
![]()
ANSWER: Well, hang on, now. Most of the time when something disasterous happens it's because we make assumptions that are necessarily true. When you are working with map projections and you see lines flying every which-way, and a ton of “out of allowed range” messages, it is almost guaranteed that you are not working with the kind of data you think you are working with!
In this case, you have made a couple of incorrect assumptions. First, you are assuming the shape information in the shapefile is stored as latitude and longitude values. This is not true, as you would have discovered if you had examined the contents of this shapefile with the cgShapeInfo program from the Coyote Library.
cgShapeInfo, 'Bezirksregion_EPSG_25833.shp'
As you examined the values in the file, you would see that these values are in projected meter space. In other words, this data has already been projected into a map projection. This is the source of your “out of allowed range” errors, since the map projection space you set up assumes you will be drawing in the space using latitude and longitude values.
Shapefiles don't, as a rule, contain map projection information in them. So, if you want to know how to set up a map projection to properly display map projected data, you have to get the map projection information from somewhere else. (Sometimes you will find text files containing this information.) From the code above, you appear to think this data is projected into a Azimuthal map projection. I think this is wrong, too. The reason I think so is in the name of the file.
I think “EPSG_25833” is a map projection code. If you look that code up on the Internet, for example, you find that—in fact—this is the code for a UTM, Zone 33N, projection that uses the WGS84 ellipsoid. Armed with this information, I think we can write a much better program to draw this shapefile. The trick will be setting up the map projection. This is easily done with the cgMap object. Note that cgDrawShapes and cgMap_Grid both use the map coordinate object that is returned from cgMap to render the drawings correctly. Many of the routines that come with IDL do not work in projected map space very well. This is one of the significant advantages of the Coyote Graphics map routines.
  cgDisplay, 700, 700
  m = Obj_New('cgMap', 'UTM', Ellipsoid=8, Zone=33, $
      Position=Aspect(1.0, Margin=0.05), Limit=[52.3, 13, 52.7, 13.8])
  shapefile = 'Bezirksregion_EPSG_25833.shp'
  cgDrawShapes, shapefile, MapCoord=m, /Projected_XY, /UseLimit
  cgMap_Grid, /Box_Axes, Color='charcoal', Map_Structure=m
Running this code results in the much improved figure below.
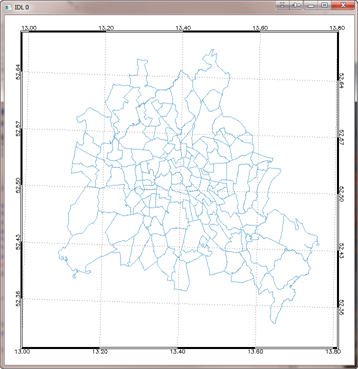 |
| Berserk shapefile tamed with Coyote Graphics map routines. |
![]()
Version of IDL used to prepare this article: IDL 7.1.2
![]()
![]()


