
Where's Maine!?
QUESTION: I'm trying to use Map_Continents with the USA keyword set to draw state boundaries on my map, but the NE states are missing. What's up with that?
Here is the code I'm using.
   Map_Set, 25.0, -105., /STEREOGRAPHIC, LIMIT=[20.0,-121.5,50.0,-76.0]
   Map_Continents, /FILL, COLOR=FSC_Color('lightgrey')
   Map_Continents, COLOR=FSC_Color('black')
   Map_Continents, /USA, COLOR=FSC_Color('red'), /OVERLAY
And here is the result.
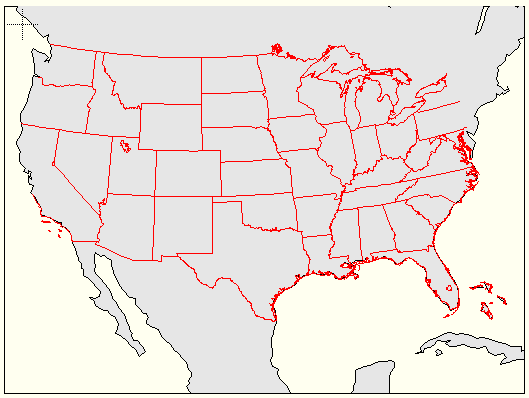 |
| All the states in the Northeast section of the United States are missing. |
![]()
ANSWER: I don't know what is up with that. Apparently some state boundaries are being clipped by the map limits you are settting, since I can get the states to draw if I change the limit and zoom out on the United States more.
One alternative, however, may be to use shapefiles to draw state outlines. IDL comes with a state shapefile in the distribution. You can draw the states using the Coyote Library routine, DrawStates, like this.
    Map_Set, 25.0, -105., /STEREOGRAPHIC, LIMIT=[20.0,-121.5,50.0,-76.0]
   Map_Continents, /FILL, COLOR=FSC_Color('lightgrey')
   Map_Continents, COLOR=FSC_Color('black')    DrawStates, COLOR='red'
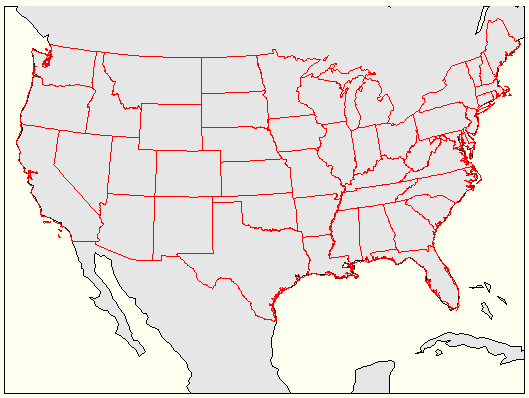 |
| All the states in the United States are now drawn. |
Update
According to IDL technical support, when Map_Continents is drawing polygons, as in the fill operation in the second IDL command above, it does not clip to the map limit boundaries. It does, however, clip map outlines to the map limit boundaries. Since Maine extends to about -66 degrees of longitude we would see all of the New England states represented if we changed the upper boundary in the LIMIT keyword from -76.0 to -66.0. I note, too, that there is a problem with California and the West Coast. Those boundaries are also clipped. It would help to see the maps with a latitude/longitude grid on them. I put these grids on the map with the original limits in the figure on the left, below. By changing the LIMIT keyword slightly to make sure the US boundaries are inside the limits, we can draw all the boundaries. Here is the code for the figure on the right, below.
   Map_Set, 25.0, -105., /STEREOGRAPHIC, LIMIT=[20.0,-124,50.0,-66.0]
   Map_Continents, /FILL, COLOR=FSC_Color('lightgrey')    Map_Grid
   Map_Continents, COLOR=FSC_Color('black')
   Map_Continents, /USA, COLOR=FSC_Color('red'), /OVERLAY
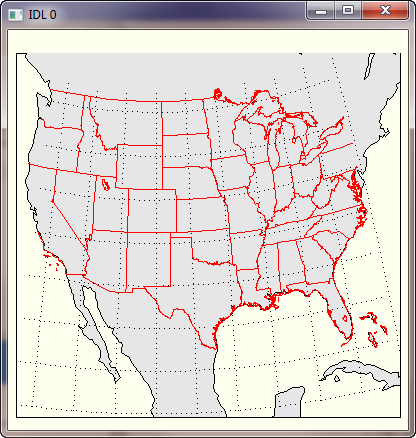 |
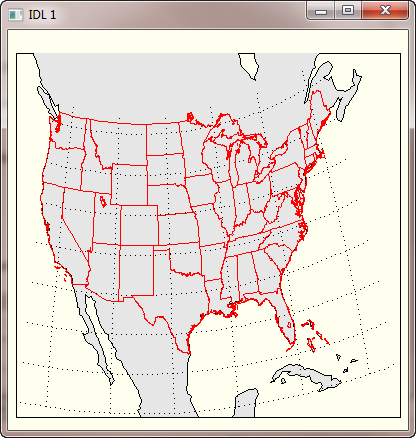 |
| Boundaries clipped to the limits on the left, but not on the right. |
![]()
Version of IDL used to prepare this article: IDL 7.1.2
![]()
Copyright © 2010 David W. Fanning
Last Updated 15 February 2010