
Adding Shapefile Information to Maps
QUESTION: I know IDL comes with a political boundary database, but I would like to use my own database. What do I have to do to put my database in a format IDL can use with Map_Set and Map_Continents ?
![]()
ANSWER: This question is a bit of a red herring, because what you draw on top of a map (with Map_Continents or anything else) has nothing to do with Map_Set or Map_Proj_Init. These two routines simply create a data coordinate space that is mapped in terms of latitude and longitude. If you have a database of any sort that uses latitude and longitude, you can draw directly onto a map projection after setting up the coordinate system.
The Map_Continents routine is simply a routine that reads a database file and uses PlotS to draw line segments. The map database file supplied with RSI has been massaged a bit to make reading the line segments easier, and it has been saved in an unformatted data file to save space, but there is nothing magical about it. It would be a mistake, probably, to try to make your database fit that format. It would be much easier to simply read the database you have (in whatever way makes sense), and draw your own lines.
A common format for many kinds of political boundaries is a shapefile. Shapefiles are in a format developed by ESRI (the creators of ArcInfo and other GIS and mapping software) for specifying information that appears on maps. A great many shapefiles can be found for free on the Internet. Other data sets can be obtained at low or no cost. In fact, IDL comes with a shape file of US states. You will find it in the normal IDL distribution ($IDL_DIR/examples/data/states.shp).
Browsing Shapefiles
The first time you encounter a shapefile you may find it a little frustrating to know what exactly is in the shapefile. So I have written a shapefile brower, named cgShapeInfo. You see an example of the ShapeInfo program using the states.shp file below.
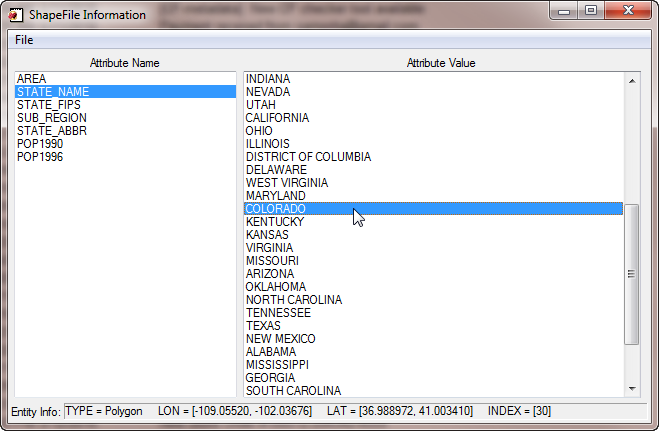 |
| The cgShapeInfo program with the states.shp file shipped with IDL. |
The left panel contains the shapefile's attribute names (used with the ATTRNAME keyword in the cgDrawShapes program described below) and the right panel contains the attribute values (used with the ATTRVALUES keyword). Clicking in the left panel will pull up the corresponding attribute values in the right panel. Clicking on a right panel name will provide information about the type of entity used in the shapefile, and the X and Y bounds of that entity, which are reported in the bottom panel. The index number is also provided. Notice that sometimes shapefiles contain values in latitude and longitude, as they do in this example, and sometimes they contain values in projected XY meter space. This is important, because if the values are in projected meter space, you are going to have to use Map_Proj_Init rather than Map_Set, to set up your map projection space. cgShapeInfo should give users enough information about their shapefiles to use the shape drawing program described below.
Displaying Shapes on Maps
To display shape file entities on maps, I have written the cgDrawShapes program. The program assumes a map data coordinate space, so one has to be in place before cgDrawShapes is called. In this example, I set up the map projection space with cgMap_Set because the shape file I am using specifies entity values in latitude and longitude coordinates.
    shapefile = Filepath(subdir=['examples','data'], 'states.shp')
    cgDisplay, 800, 700
    cgMap_Set, 37.5, -117.5, /Albers, /IsoTropic, Limit=[30, -125, 45, -108], $
        Position=[0.05, 0.05, 0.95, 0.95]
    cgDrawShapes, shapefile, AttrName='STATE_ABBR', $
        AttrValues=['CA', 'OR', 'WA', 'AZ', 'UT', 'ID', 'NV'], Thick=1, $
        FColors=['firebrick', 'grn4', 'pur4', 'tan4', 'steel blue', 'org4', 'yellow'], $
        Fill = Replicate(1, 7), Colors='charcoal'
    cgMap_Grid, LatDel = 2.0, LonDel = 2.0, /Box_Axes, Color='charcoal'
You see the result of running the example program in the figure below.
 |
| The state boundaries from the states.shp file shipped with IDL. |
You can do the same thing is you use Map_Proj_Init to set up the map projection space. In this example, Map_Proj_Init is set up calling the more useful cgMap object, which is, among other things, a direct wrapper for Map_Proj_Init.
    shapefile = Filepath(subdir=['examples','data'], 'states.shp')
    cgDisplay, 800, 700, WID=1
    mapCoord = Obj_New('cgMap', 'Albers Equal Area', LIMIT=[30, -125, 45, -108], $
                  Position=[0.05, 0.05, 0.95, 0.95], CENTER_LATITUDE=37.5, $
                  CENTER_LONGITUDE=-117, STANDARD_PAR1=40, STANDARD_PAR2=-39)
    cgDrawShapes, shapefile, AttrName='STATE_ABBR', $
        AttrValues=['CA', 'OR', 'WA', 'AZ', 'UT', 'ID', 'NV'], Thick=1, $
        FColors=['firebrick', 'grn4', 'pur4', 'tan4', 'steel blue', 'org4', 'yellow'], $
        Fill = Replicate(1, 7), Colors='charcoal'
    cgMap_Grid, LatDel = 2.0, LonDel = 2.0, /Box_Axes, Color='charcoal'
The second example uses a US counties shapefile, that I renamed co_counties.shp. I obtained this file for free on the Internet. You can supply the name of your own shapefile in this example. In this case, the Colorado county entities are specified in projected XY meter space, so I am going to set up the map projecton with cgMap, an intelligent wrapper for Map_Proj_Init. I also have to set the Projected_XY keyword on cgDrawShapes to make sure I am drawing on the map properly.
I obtained the map projection information, including the UTM zone, from reading the co_counties.xml file that I obtained along with the shape file.
   shapefile = 'C:\IDL\data\shapefiles\co_counties.shp'
   cgDisplay, 500, 500, Title='County Boundaries'
   map = Obj_New('cgMap', 'UTM', Datum=8, Zone=13, Position=[0.05, 0.05, 0.95, 0.95])
   cgDrawShapes, shapefile, AttrName='COUNTY', MapCoord=map, /Projected_XY
   cgMap_Grid, LatDel = 2.0, LonDel = 2.0, /Box_Axes, Color='charcoal', $
      Map_Structure=map
You see the results in the figure below.
 |
| The county boundaries from the co_counties shapefile. |
![]()
Drawing Shapes Automatically
You may not be aware of or have access to map projection information, but you would like to be able to at least draw the shapes in the shapefile so you can see what they are. If you find yourself in this situation, you can set the AutoDraw keyword to cgDrawShapes and the file will be scanned for the shape file boundary and a coordinate system will be set up to allow the shapes to be drawn inside that boundary.
For example, if you didn't have access to the map information in the co_counties.xml file described above, you could still draw the shapes in the file by writing code like this.
   shapefile = 'C:\IDL\data\shapefiles\co_counties.shp'
   cgDrawShapes, shapefile, /AutoDraw
You can see the results in the figure below.
 |
| Drawing Colorado counties automatically. |
![]()
Copyright © 2006-2012 David W. Fanning
Written 21 October 2006
Last Updated 20 August 2012


