
Sea Masks on Map Projections
QUESTION: I have some data that I want to display as contours on a map projection of a continent. But the contours extend over the water and the data pertains only to the land mass. What I would like to do is mask all the contours overlaying water out of my display. But I can't find an easy way to do this. Can it be done in IDL?
![]()
ANSWER: If by "easy way" you mean by setting a keyword or calling an IDL command to do it, then no, there is no easy way. But it can be done, however. :-)
Editor's Note:The first part of this article describes a method I introduced in 2003. The second part of the article describes a method from 2012. You may wish to read the second part of the article first, depending upon how much your own IDL skills have advanced this century.
The essential technique is to create a sea mask. You might think this would be done with a routine like MapContinents and a WaterOnly keyword, but life is not so simple. We do need to use MapContinents, however, because it is possible to create a land mask with that command. The sea mask is, of course, the inverse of the land mask.
There are probably a number of different ways to do this. I'm going to show you a method that involves the Z-graphics buffer, simply because this is easy and straightforward. I want the masks to be simple 8-bit images, and these are easy to create in an 8-bit device like the Z-graphics buffer, and more difficult to create on a 24-bit device. (Although it certainly can be done.)
I have demonstrated the technique in an example program, named Seamask, which I will take you through in detail here. The program takes some simulated random data at random locations over the United States land mass, grids the data so it can be contoured, and displays it on a map projection. You will need to download the cgColor program from the Coyote Library to be able to run the example program
The first part of the program simply creates the random data that will be contoured and sets up the colors to be used. It looks like this.
   PRO SEAMASK

   ; Program needs non-decomposed color.
   IF (!D.Flags AND 256) NE 0 THEN Device, Decomposed=0, Get_Decomposed=theState

   ; Pick a seed, so you see what I see. Create data.
   seed = -5L
   lat = RANDOMU(seed, 50) * (24) + 23
   lon = RANDOMU(seed, 50) * 65.0 - 120
   data = RANDOMU(seed, 50) * 100

   ; Colors for plot.
   landColor    = !D.Table_Size-2
   contourColor = !D.Table_Size-3
   seaColor     = !D.Table_Size-4
   dataColor    = !D.Table_Size-5
   usaColor     = !D.Table_Size-6
   contColor    = !D.Table_Size-7
   TVLCT, cgColor('Wheat', /Triple), landColor
   TVLCT, cgColor('Firebrick', /Triple), contourColor
   TVLCT, cgColor('Sky Blue', /Triple), seaColor
   TVLCT, cgColor('Coral', /Triple), dataColor
   TVLCT, cgColor('Dark Gray', /Triple), usaColor
   TVLCT, cgColor('Indian Red', /Triple), contColor
I want the map to be an 8-bit image. This is most easily done in the Z-graphics buffer, which is an 8-bit device, where the TVRD command will return an 8-bit image. This can also be done on a 24-bit device, but you will have to be a bit more careful. I enter the Z-graphics buffer and get it set up with these commands.
   ; The TVRD's require an 8-bit image. This is most
   ; easily done in the Z-graphics buffer.
   thisDevice = !D.Name
   Set_Plot, 'Z', /Copy
   Device, Set_Resolution=[500, 350]
   Erase, Color=0
Next, I set up my map projection space. This is most easily done by ensuring the map projection extends to the edges of the display window, but it doesn't have to do this. If you prefer not to do this, you will probably have to use the POSITION keyword to position your map projection and then calculate exactly where the image is in the larger window so that it can be extracted for the mask. I've made it easy on myself by using the entire window for the mask, which I can capture using TVRD without any arguments.
   ; Set up the map projection of the US continent.
   MAP_SET, 15, -87, 0, LIMIT=[23,-125,50,-67], /NOBORDER, $
      /MERCATOR, /NOERASE, POSITION=[0,0,1,1], $
      XMARGIN=0, YMARGIN=0

   ; Draw the filled continental outlines.
   MAP_CONTINENTS, /Fill_Continents, Color=255

   ; Use a snapshot of this image for a sea mask.
   snap = TVRD()
   mask = (snap EQ 0)
   sea =  mask * seaColor
Now I draw the essential elements of my map projection, including the sea, land, state boundaries, and the data and contour locations themselves.
   ; Draw the sea, the continental outlines, and the USA state boundaries.
   cgImage, sea
   MAP_CONTINENTS, /Fill, Color=landColor
   MAP_CONTINENTS,  Color=contColor
   MAP_CONTINENTS, /USA, Color=usaColor

   ; Plot the random data locations.
   cgPLOTS, lon, lat, PSYM=4, COLOR=dataColor

   ; Grid the irregularly spaced data.
   gridData= SPH_SCAT(lon, lat, data, $
      BOUNDS=[-125., 23., -67., 50.], GS=[0.5,0.5], BOUT=bout)

   ; Calculate xlon and ylat vectors corresponding to gridded data.
   s = SIZE(gridData, /DIMENSIONS)
   xlon = FINDGEN(s[0])*((bout[2] - bout[0])/(s[0]-1)) + bout[0]
   ylat = FINDGEN(s[1])*((bout[3] - bout[1])/(s[1]-1)) + bout[1]

   ; Put the contours on the map.
   cgCONTOUR, gridData, xlon, ylat, /OVERPLOT, NLEVELS=12, C_COLOR=contourColor, $
      C_LABEL=Replicate(1, 12), /DOWNHILL
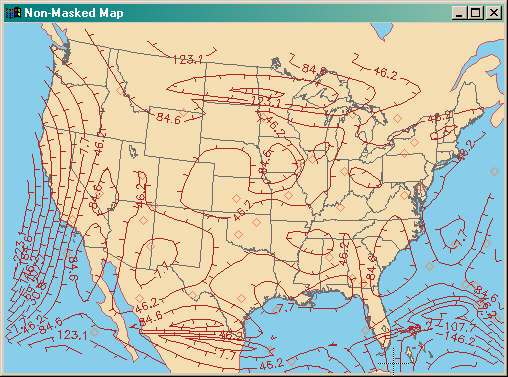
I want to save what is currently in the window as the "without sea mask" result.
   ; Take a snapshot of what is currently in the window.
   contourImage = TVRD()
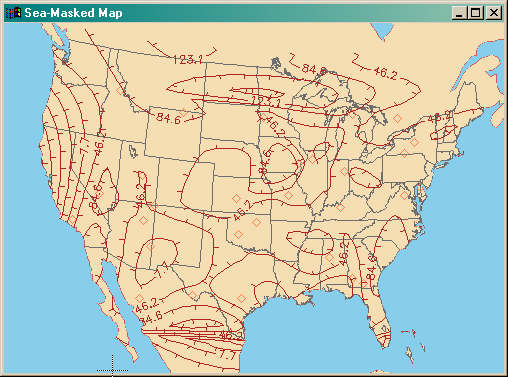
What I need to do now is replace the sea pixels in the contour image with the corresponding pixels from the sea image. The code looks like this.
   ; Replace the sea pixels in the contour image with pixels from the sea image.
   theSea = Where(sea GT 0, count)
   finalImage = contourImage
   IF count GT 0 THEN finalImage[theSea] = sea[theSea]
Finally, we return from the Z-graphics buffer and display the two images.
      ; Back to the display device and display the two images.
   Set_Plot, thisDevice
   IF (!D.Flags AND 256) NE 0 THEN Window, XSIZE=500, YSIZE=350, Title='Non-Masked Map'
   cgIMAGE, contourImage
   IF (!D.Flags AND 256) NE 0 THEN Window, 1, XSIZE=500, YSIZE=350, Title='Sea-Masked Map'
   cgIMAGE, finalImage

   ; Set the decomposed state back.
   IF N_Elements(theState) NE 0 THEN Device, Decomposed=theState
   END
You can see the results of the Seamask program in the two figures below.
![]()
Creating a USA-Only Mask
Recently, I was asked a similar question, but this person wanted to see contours only over the continental United States. In suggesting a solution to this problem, I realized how much things had changed since I first wrote this article in 2003. I thought it would be worth noting how I would solve this problem in 2012. In particular, this person would like to see the solution in a high-resolution raster file, as well as see the output on his display screen. Here is the code I used.
The main difference in the two solutions is that in this solution I am going to use a shapefile to create the mask, and I am going to use Coyote Graphics routines to display the graphics, which means I no longer have to worry about decomposed color. Coyote Graphics routines work the same in either indexed or decomposed color mode. The name of the new routine is USAMask.
High-resolution raster files are obtained from PostScript intermediate files, so this program has to have the ability to create PostScript files. I can do this in several ways, but in this case I will define a PostScript keyword that can be set to produce a PostScript file. The initial lines of the file look like this.
   PRO USAMASK, PostScript=postScript

   ; Leave room at the top of the plot for a color bar.
   position=[0.1,0.1,0.9,0.84]

   ; Pick a seed, so you see what I see. Create data.
   seed = -5L
   lat = cgScaleVector(RANDOMU(seed, 50),  10,  60)
   lon = cgScaleVector(RANDOMU(seed, 50), -130, -50)
   data = Smooth(RANDOMU(seed, 50) * 100, 3)
Next, we open a pixmap window to create the mask. The mask is created by using a shapefile to create the USA outline. The code looks like this.
   ; Open a display window to  make a mask.
   cgDisplay, 800, 675, Color='black', /Free, /Pixmap

   ; Set up the map projection of the US continent.
   cgMap_Set, 15, -87, 0, LIMIT=[23,-125,50,-67], /NOBORDER, $
      /MERCATOR, /NOERASE, POSITION=position, $
      XMARGIN=0, YMARGIN=0

   ; Draw the USA outline in white on the black background. Make a mask.
   shapefile = Filepath(subdir=['examples','data'], 'states.shp')
   cgDrawShapes, shapefile, AttrName='STATE_ABBR', Thick=1, $
       FColors=['white'], Fill = 1, Colors='white'
   mask = TVRD() GT 0

   ; Delete the mask window.
   WDelete, !D.Window
Next, we open a display window. If we plan to do create a PostScript file, we will do this in a pixmap window (a window in memory), so the user won't see it.
  ; Open a display window. Use a pixmap if creating a PostScript file.
  cgDisplay, 800, 675, PIXMAP=Keyword_Set(postScript), /FREE
Next, we draw the contour plot. Here we let cgContour draw the irregular contours and add contour outlines to the filled contour plot.
   ; Put the contours on the map.
   ncolors = 16
   cgLoadCT, 4, /Brewer, /Reverse, NColors=ncolors, Bottom=1
   step = Round((Ceil(Max(data)) - Floor(Min(data))) / ncolors)
   levels = Indgen(ncolors) * step + Floor(Min(data))
   cgContour, data, lon, lat, /OVERPLOT, LEVELS=levels, /IRREGULAR, $
       C_COLOR=Indgen(ncolors)+1, /FILL, /Outline, LABEL=1, COLOR='black'
We take a snapshot of what is currently in the display window. And then we multiple each "frame" of the snapshot by the mask we created above. We set the value of the zeros to whatever background color we want to use.
   ; Take a snapshot of what is currently in the window.
   contourImage = cgSnapshot(TRUE=3)

   ; Multiply the contourImage times the mask.
   zeros = Where(mask EQ 0)
   background_color = cgColor('light gray', /Triple)
   FOR j=0,2 DO BEGIN
        temp  = contourImage[*,*,j] * mask
        temp[zeros] = background_color[j]
        contourImage[*,*,j] = temp
   ENDFOR
Now, we simply display the contour image and the colorbar, taking care to set up the PostScript device, if needed. The code looks like this. The PNG keyword on the cgPS_Close command will create a PNG file from the PostScript intermediate file.
   ; Set up the PostScript device, if needed.
   IF Keyword_Set(postscript) THEN cgPS_Open, File='usamask.ps'

   ; Redisplay the image.
   cgImage, contourImage

   ; Display a color bar.
   cbrange = [Min(levels), Ceil(Max(levels)+step)]
   cgColorbar, /Discrete, NCOLORS=ncolors, BOTTOM=1, RANGE=cbrange, $
       AnnotateColor='black'

   ; Close the PostScript device and create the PNG file with ImageMagick.
   IF Keyword_Set(postscript) THEN cgPS_Close, /PNG
   END
You see the result in the figure below.

![]()
Copyright © 2003 David W. Fanning
Written 16 July 2003
Last Updated: 28 August 2012