
Filling the Background of a Plot


QUESTION: I am trying to fill the background of a function graphics plot with a specific color. I've read the (exceedingly poor) documenation, but I just can't seem to figure it out. It would seem straightforward, as there are keywords for doing this, it appears: Fill_Background, Fill_Color, etc. I tried the intuitive thing, but only the portion of the background under the curve is filled.
   data = cgDemoData(1)
   p = Plot(data, Fill_Background=1, Fill_Color='pink')
You see the results in the figure below.
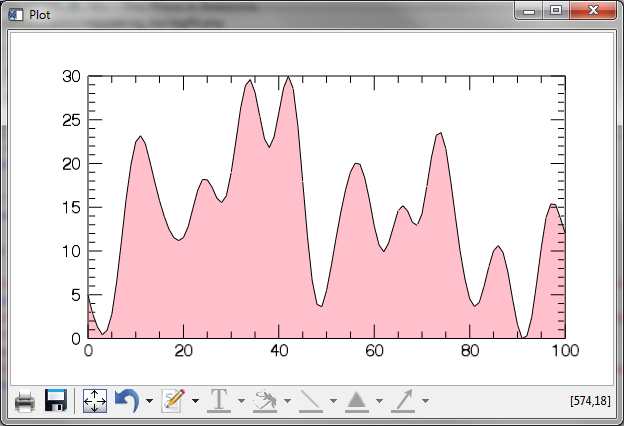 |
| Only the plot background under the curve is filled with color. |
I don't really understand the purpose of the Fill_Level keyword, but presumably if I set this to the limit of the Y axis, the background should fill the entire plot. It doesn't.
p = Plot(data, Fill_Background=1, Fill_Color='pink', Fill_Level=30)
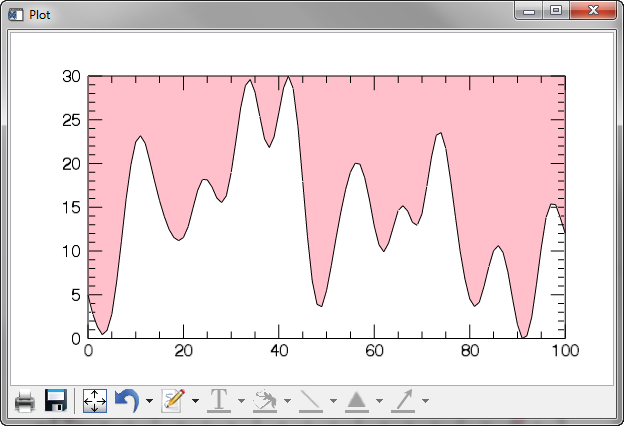 |
| Now the plot background on top of the curve is filled with color. |
Is there any way to fill the entire plot background with color?
![]()
ANSWER: The (non-intuitive) way to do this is to use two plots. The second plot draws a line along the X axis, and then uses the extent of the Y axis of the first plot as input to the Fill_Level keyword. Finally, the first plot is moved in front of the second plot. The code looks like this.
   data = cgDemoData(1)
   p1 = Plot(data)
   p2 = Plot(Overplot=p1, p1.xrange, [0,0], Fill_Background=1, $
          Fill_Color='pink', Fill_Level=30)
   p1.Order, /Bring_To_Front
You see the results in the figure below.
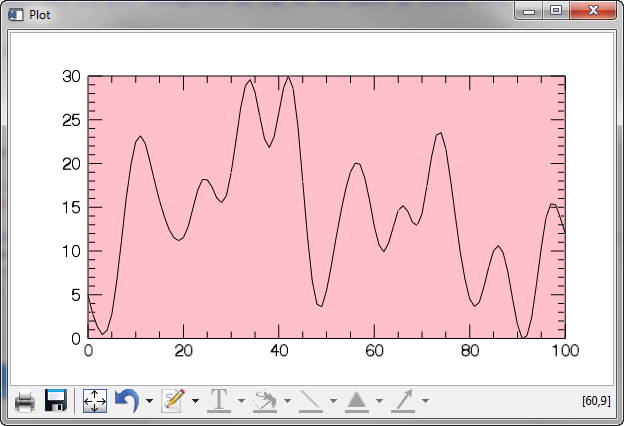 |
| The entire plot background filled with color. |
![]()
Version of IDL used to prepare this article: IDL 8.2.3.
![]()
![]()


