
Dashed Lines Appear Solid


QUESTION: I create a functions graphics plot with a dashed or dotted line, but when I save the plot output in either PDF or PostScript output, it appears as a solid line. I have no problem with PNG or JPEG output. I'm using IDL 8.2.3. Is this a bug in this version of IDL?
Here is the code I am using.
   p = Plot(cgDemoData(1), Linestyle='dashed')
   p.save, 'example.ps'
In the figures below, you see what the plot looks like on the display and as a PostScript file.
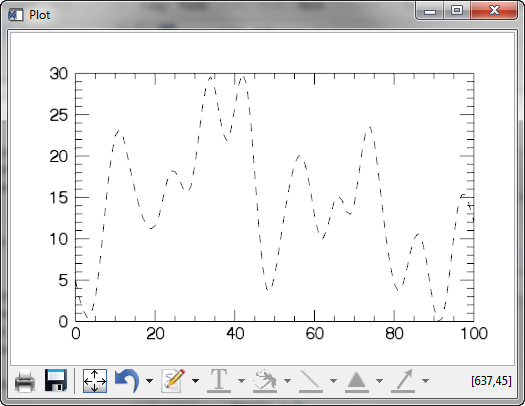 |
| The plot on the display. |
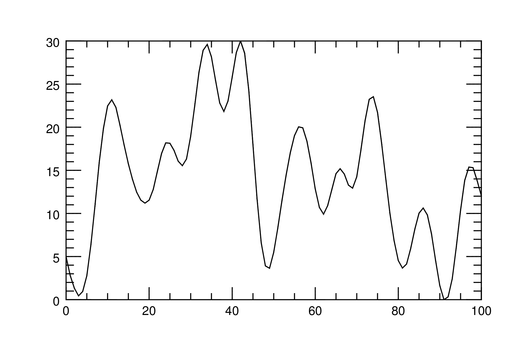 |
| The plot as a PostScript file. |
![]()
ANSWER: Yes, this is a bug in version 8.2.3 of IDL. It affects all machine versions of IDL.
If you need this plot with a dashed or dotted line, you can use Coyote Graphics to obtain it. Here is how this plot would be created as a PostScript file in Coyote Graphics.
cgPlot, cgDemoData(1), LineStyle=2, Output='coyote_example.ps'
You see the result in the figure below.
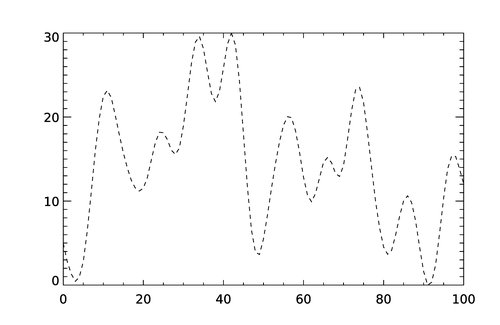 |
| The plot as a PostScript file using Coyote Graphics. |
![]()
Version of IDL used to prepare this article: IDL 8.2.3.
![]()
![]()


