Contouring Irregular Data on Maps
QUESTION: I'm trying to plot contours of some irregularly spaced data on a map of the Eastern United States. The values themselves are not a problem, but getting the contour lines to overplot on the map is. How is it done?
![]()
ANSWER: The problem with gridding irregular data and then trying to contour the resulting gridded array on a map is almost always getting the vectors that go with the gridded data formed properly. (Remember that on a map projection the CONTOUR command will need to be called with all three of its positional parameters.)
Here is a little program that creates some random data in a map projection of the Eastern United States and shows how to grid it and lay it on top of the map projection.
I'm using the IDL library routine SPH_SCAT as a front end for the built-in IDL gridding routines TRIANGULATE and TRIGRID. These two routines perform the gridding of the random or irregular data. They can be used to perform spherical gridding, which is what the SPH_SCAT interface gives me access to. (In other words, the Delaunny traiangles that are returned from TRIANGULATE will be spherical triangles rather than flat, 2D triangles.)
The trick to putting a contour plot of gridded data on top of a map projection is using the BOUT keyword to get the output bounds of the gridded data and using these bounds to make the appropriate second and third vector parameters (xlon and ylon in this example) that are required by the CONTOUR command.
Here is an example program to show you how it is done.
PRO EXAMPLE

   ; Pick a seed, so you see what I see. Create data.
   seed = -1L
   lat = RANDOMU(seed, 40) * (24./1.0) + 24
   lon = RANDOMU(seed, 40) * 40.0/1.0 - 112
   data = RANDOMU(seed, 40) * 1000

   ; Set up the map projection of the Eastern US.
   MAP_SET, 15, -87, 0, LIMIT=[24,-115,49,-67], $
      /CONTINENTS, /USA, /MERCATOR

   ; Plot the random data locations.
   PLOTS, lon, lat, PSYM=4, COLOR=FSC_Color('green')

   ; Grid the irregularly spaced data.
   gridData= SPH_SCAT(lon, lat, data, $
      BOUNDS=[-115., 24., -67., 49.], GS=[0.5,0.5], BOUT=bout)

   ; Calculate xlon and ylat vectors corresponding to gridded data.
   s = SIZE(gridData)
   xlon = FINDGEN(s(1))*((bout(2) - bout(0))/(s(1)-1)) + bout(0)
   ylat = FINDGEN(s(2))*((bout(3) - bout(1))/(s(2)-1)) + bout(1)

   ; Put the contours on the map.
   CONTOUR, gridData, xlon, ylat, /OVERPLOT, NLEVELS=10, C_COLOR=FSC_Color('yellow')

   END
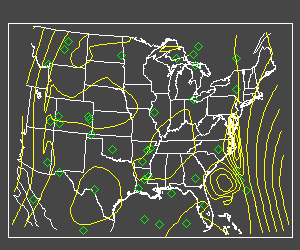
Your output should look like the display below.
 |
| Irregular data contoured over a map projection in IDL. |
![]()
Copyright © 1996 David W. Fanning
Last Updated 2 December 1996


