
How to Create 3D Scatterplot
The simplest way to create a 3D scatterplot is to use the SURFACE command to create a 3D coordinate space with axes. (See the tip "How do I create 3D Axes." Then the PLOTS command is used to place the data in the 3D space. (You can see an example of this plot, using Coyote Graphics commands, in the Coyote Plot Gallery).
The trick in setting up a 3D coordinate space is to save the 3D transformation in the !P.T system variable. You do this with the SAVE keyword to the SURFACE command. The T3D keyword assures that the PLOTS command uses the 3D transformation matrix loaded in !P.T.
I have written an example program, named Scatter3D, for displaying a 3D scatterplot of random data. You can see an example of the 3D scatterplot created by running the program in the figure below.
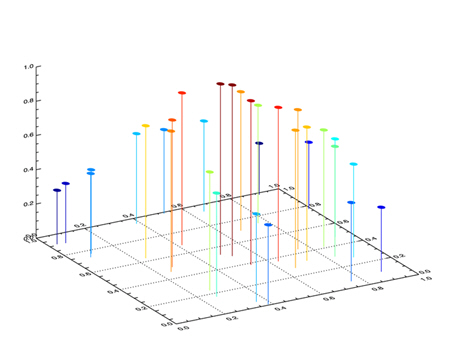 |
| Scatterplot created in IDL direct graphics. |
Note that you can do the same thing in object graphics. Here is an example program, named Scatter_Surface, that shows you how. Of course, in object graphics, the surface is completely rotatable, which greatly improves viewing of the surface elements.
The figure below shows what the figure looks like in an object graphics window. If you run the program, grab the surface by clicking on it with the mouse and you can rotate it in 3D space. Note that the symbols used in this object graphics scatterplot are also rendered in 3D. This is not possible in the direct graphics plot.
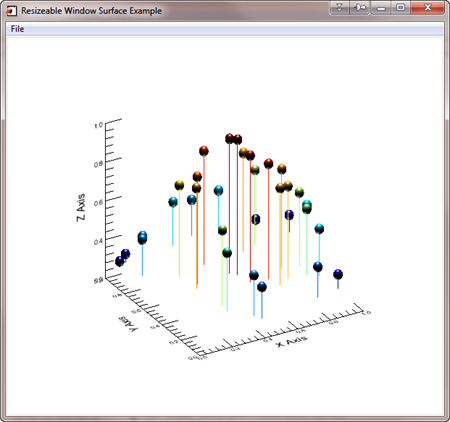 |
| Scatterplot created in IDL object graphics. This plot can be rotated in 3D space. |
![]()
Scatterplot on a Map Projection
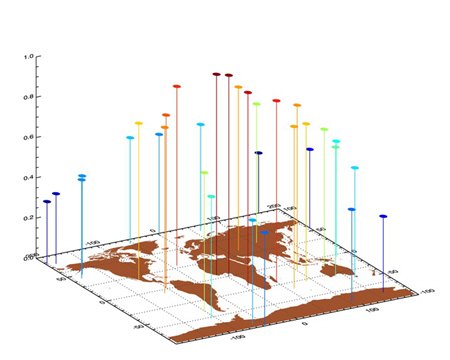
From time to time, people want to place a 3D scatterplot on top of a map projection. Here is a program containing a few modifications to Scatter3D that allows you to do exactly that. (You will need cgScaleVector from the Coyote Library to run the program.) The only particular tricks in the program are to be sure to set the Z range in your surface plot position to [0,1], and be sure to save the plotting system variables after the Surface command and before the Map_Set command, since the Map_Set command will change the values in some weird way even I don't understand.
Here is an example of the output from the Scatter3D_On_Map program.
![]()
Written 6 April 2006
Updated 1 March 2012