
Contours and Contour Colors Explained


QUESTION: There is something I don't understand about filled contours and color bars. Suppose I have data that goes from -10 to +10 and I want the first 10 colors to be displayed in blue colors and the next 10 colors to be displayed in red colors. I would normally do something like this.
   data = cgScaleVector(cgDemoData(26), -10, 10)
   ncontours = 21
   cgLoadCT, 22, /Brewer, /Reverse, NColors=ncontours
   clevels = cgScaleVector(Findgen(ncontours), -10, 10)
   colors = Bindgen(ncontours)
   cgContour, data, Levels=clevels, C_Colors=colors, /Fill, /Outline, $
      Position=[0.125, 0.125, 0.925, 0.8]
   cgColorbar, NColors=ncontours, Range=[-10,10]
But you can see from the figure below that this is not right. My color bar colors do not match my contour colors. I really need just 20 colors in my color bar, 10 for blue and 10 for red. But if I set ncontours to 20, then my contour labels are all screwed up! What am I doing wrong?
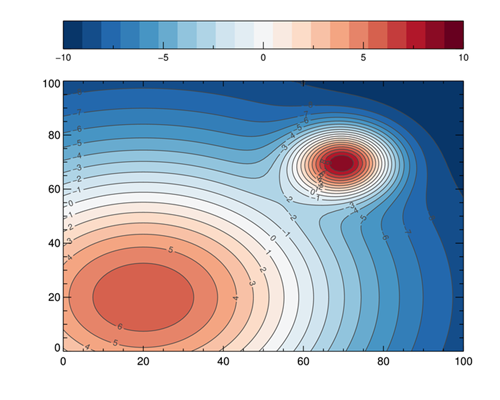 |
| The colors in the color bar do not match the contour colors. |
![]()
ANSWER: Yes, this is a bit confusing. Let's see if we can clarify the situation with a simple example. Let's create a data set that goes from -3 to +3.
data = cgScaleVector(cgDemoData(26), -3, 3)
Suppose we want to contour this data set so that the values between -2 and -1 is colored dark blue, -1 to 0 is light blue, 0 to 1 is light red, and 1 to 2 is dark red. We might do this. Let's load these four colors starting at color index 1 in the color table. Let's also display the contour plot with a gray background color. The code will look like this.
   ncolors = 4
   cgLoadCT, 0 ; Start with clean color slate.
   TVLCT, cgColor(['blu6', 'blu2', 'red2', 'red6'], /Triple), 1
   clevels = [-2, -1, 0, 1, 2]
   colors = Bindgen(ncolors) + 1B
   cgErase
   cgColorFill, Color='gray', Position=[0.125, 0.125, 0.925, 0.8]
   cgContour, data, Levels=clevels, C_Colors=colors, /Fill, /Outline, $
       Position=[0.125, 0.125, 0.925, 0.8], /Noerase
   cgColorbar, NColors=ncolors, Bottom=1, Range=[-2, 2], /Discrete, Minor=0
You see the results in the figure below. Humm. A little weird. Let's see if we can figure out what is going on.
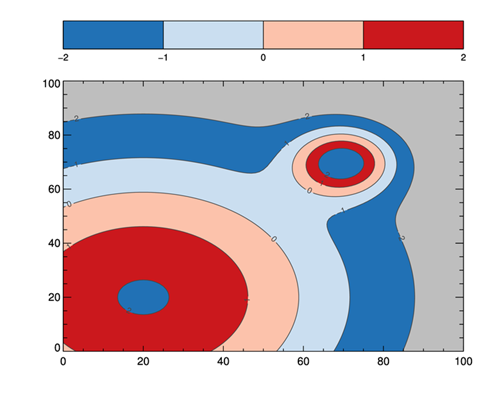 |
| The colors in contour plot are a little weird. |
The first thing to notice is that the colors in the color bar are correct and, in fact, we have colored the the contours we hoped to color with the correct colors. But, why is there a gray color in our contour plot, and what in the world is that dark blue color doing in the middle of our dark red!?
The answer comes from realizing there are always two other colors displayed in a filled contour plot. One is what I term the "background" color. This is the color that is used to fill the contour plot from the minimum value of the data until the first contour level (-2 in our example). This color is taken from the background color of the plot itself and is responsible for what users often perceive as holes in their contour plots. The other is the "everything else" color, which is used to fill the contour plot from the last contour level (2 in our example) to the maximum value in the data. This is what is giving us a dark blue color in the midst of our dark red color.
But, why is this color dark blue, the same color we are using for our lowest contour level? This is because contour colors are recycled. You specified which color indices to use with the C_Colors keyword. You said use the color table indices 1 to 4. But, you needed five colors, so the fifth color (the "everything else" color) simply recycled the color table indices and used the first index, the color we loaded into color table index 1.
We can acknowledge this color exists, but it means loading one more color into the color table than we have contour levels, or that we plan to use in the color bar. We also have to adjust the contour colors vector to accommodate this extra color. Let's use the color "charcoal" for this color. Our modified code might look like this.
   ncolors = 4
   cgLoadCT, 0 ; Start with clean color slate.
   TVLCT, cgColor(['blu6', 'blu2', 'red2', 'red6', 'charcoal'], /Triple), 1
   clevels = [-2, -1, 0, 1, 2]
   colors = Bindgen(ncolors + 1 ) + 1B
   cgErase
   cgColorFill, Color='gray', Position=[0.125, 0.125, 0.925, 0.8]
   cgContour, data, Levels=clevels, C_Colors=colors, /Fill, /Outline, $
       Position=[0.125, 0.125, 0.925, 0.8], /Noerase
   cgColorbar, NColors=ncolors, Bottom=1, Range=[-2, 2], /Discrete, Minor=0, $
      OOB_Low='gray', OOB_High=5B
You see the result in the figure below.
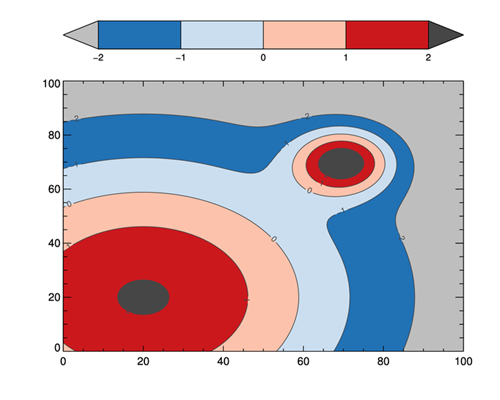 |
| A contour plot with all the colors accounted for. |
Of course, if we didn't want to see either of these two "extra" colors, we can make them the same color as the true background color of the plot, or "white" in this example. The code would look like this.
   ncolors = 4
   cgLoadCT, 0 ; Start with clean color slate.
   TVLCT, cgColor(['blu6', 'blu2', 'red2', 'red6', 'white'], /Triple), 1
   clevels = [-2, -1, 0, 1, 2]
   colors = Bindgen(ncolors + 1 ) + 1B
   cgContour, data, Levels=clevels, C_Colors=colors, /Fill, /Outline, $
       Position=[0.125, 0.125, 0.925, 0.8]
   cgColorbar, NColors=ncolors, Bottom=1, Range=[-2, 2], /Discrete, Minor=0
You see the results in the figure below. Now only the specified contour levels are colored. Note that the number of contour levels specified in the clevels variable is one more than the number of contours you are filling. This is because you are specifying the boundaries of the color levels, not the contour levels themselves.
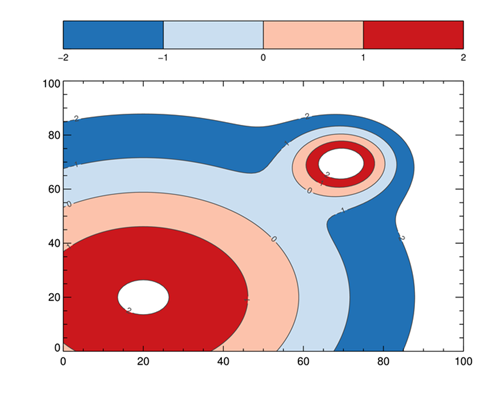 |
| A contour plot with only the contours specified colored. |
Given this information, the way to answer your original question, is to set up your plot like this.
   data = cgScaleVector(cgDemoData(26), -10, 10)
   ncontours = 20
   cgLoadCT, 22, /Brewer, /Reverse, NColors=ncontours, Bottom=1
   TVLCT, cgColor('white', /Triple), ncontours+1 ; Everything else color (not used here)
   clevels = cgScaleVector(Findgen(ncontours+1), -10, 10)
   colors = Bindgen(ncontours+1) + 1B
   cgContour, data, Levels=clevels, C_Colors=colors, /Fill, /Outline, $
      Position=[0.125, 0.125, 0.925, 0.8]
   cgColorbar, NColors=ncontours, Range=[-10,10], Divisions=10, $
      Bottom=1, Ticklen=0.001
You see the results in the figure below.
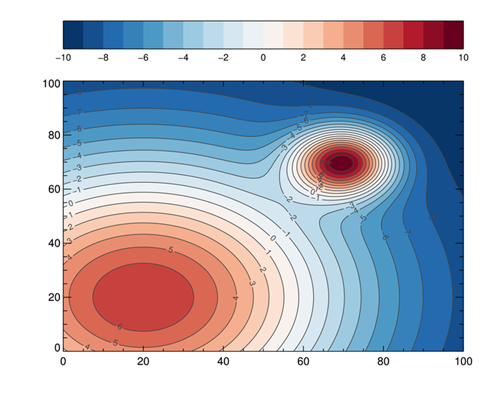 |
| The contour plot as desired. |
![]()
Version of IDL used to prepare this article: IDL 8.2.
![]()
![]()


