
Creating a Color Filled Contour Plot
QUESTION: My filled color contour plot seems to have a hole in it. This is especially noticable when I display the filled plot in PostScript. I notice none of the filled contour plots in the Coyote Plot Gallery has this problem. Can you show me how I can eliminate this hole?
![]()
Editor's Note: Because of the problems with the Contour command described in this and other articles, most users have migrated to the cgContour command. This command is part of the Coyote Graphics System in the Coyote Library. To learn more about contour plotting, you can now download the entire Contour Plot chapter from David Fanning's new book, Traditional IDL Graphics: Using Familiar Tools Creatively.
![]()
ANSWER: There are several oddities with filled contour plots, and most of them are tickled when you allow IDL to choose the contour intervals for you by using the NLevels keyword to the Contour command. To give you an idea of what some of the problems are, consider the IDL commands below and the output they generate. The idea is to create a filled contour plot with 12 contour levels. Notice, I use the NLevels keyword to select the levels. According to the IDL documentation, IDL should select 12 "approximately equally spaced contour intervals". (If you would like to run this program on your machine, you will need to install the Coyote Library on your machine.
![]()
    ; Set up the data and colors for a filled contour plot.
    levels = 12
    data = cgDemoData(2)
    x = cgScaleVector(Findgen(41), 0, 100)
    y = cgScaleVector(Findgen(41), 0, 50)
    cgLoadCT, 33, NColors=12, Bottom=3

    ; Draw the first plot. Let IDL select contour intervals by
    ; using the NLEVELS keyword.
    Window, 0, Title='IDL Selected Contour Intervals', XSize=300, YSize=400
    SetDecomposedState, 0, CurrentState=state
    Contour, data, x, y, /Fill, C_Colors=Indgen(levels)+3, Background=cgColor('white'), $
       NLevels=levels, Position=[0.1, 0.1, 0.9, 0.80], Color=cgColor('black')
    Contour, data, x, y, /Overplot, NLevels=levels, /Follow, Color=cgColor('black')
    SetDecomposedState, state
    cgColorBar, NColors=12, Bottom=3, Divisions=6, $
       Range=[Min(data), Max(data)], Format='(I4)', $
       Position = [0.1, 0.9, 0.9, 0.95], AnnotateColor='black'
![]()
The output of these commands is shown below.
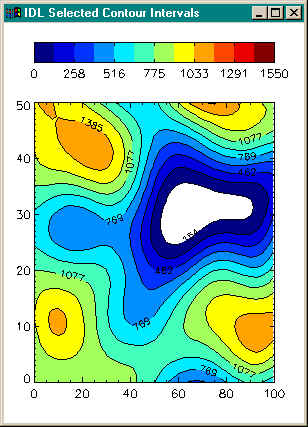
What you should notice immediately is that there is a hole in the contour plot (which is easily seen here, since I made the background color white). You might also notice that only nine colors are used in the plot. In fact, IDL has calculated only nine contour intervals! This appears to be a bug to me and I am investigating it with RSI. (I'm running IDL 5.2 on a Windows NT 4 machine.) [Editor's Note: Apparently, this is not a bug. Technical support advised me that if I wanted 12 contour intervals I should “try setting NLEVELS to 14 or 15.” In any case, we are up to IDL 8.2 now, and IDL still works this way.]
The hole comes about because IDL fills the space between the first contour interval (about value 154 here) to the second contour interval (about value 307). What we really want is for IDL to fill the space between what we might think of as the "zeroth" contour interval to the first contour interval. (Here the "zeroth" contour interval might have the value of 0, or the minimum value of the data set.)
If this is what we want, then we have to do it ourselves. The Levels keyword allows us to specify exactly which contours levels should be drawn. Assuming we want the first contour interval to be the "zeroth" level, and that we want 12 equally-space contour intervals, we can write the appropriate code like this:
![]()
    Window, 1, Title='User Specifed Contour Intervals', XSize=300, YSize=400
    step = (Max(data) - Min(data)) / levels
    userLevels = IndGen(levels) * step + Min(data)
    print, userlevels
    SetDecomposedState, 0, CurrentState=state
    Contour, data, x, y, /Fill, C_Colors=Indgen(levels)+3, Background=cgColor('white'), $
       Levels=userLevels, Position=[0.1, 0.1, 0.9, 0.80], Color=cgColor('black')
    Contour, data, x, y, /Overplot, Levels=userLevels, /Follow, Color=cgColor('black')
    SetDecomposedState, state
    cgColorBar, NColors=12, Bottom=3, Divisions=6, $
       Range=[Min(data), Max(data)], Format='(I4)', $
       Position = [0.1, 0.9, 0.9, 0.95], AnnotateColor='black'
![]()
The results of this code is shown below. Notice that the hole has disappeared and that we are now using all 12 contour colors.
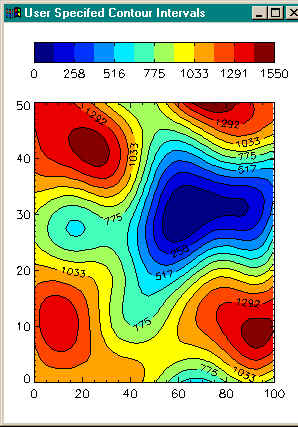
The bottom line is that if you want to make correctly filled contour plots without holes and with the number of contour intervals you specify, you absolutely must create your own contour levels and use the Levels keyword. You must never let IDL select the levels for you by using the NLevels keyword.
Reimar Bauer wishes me to point out that for filled contour plots, the X and Y vectors, if supplied, must be arranged in increasing order. This ensures that the polygons generated will be in counterclockwise order, as required by the mapping graphics pipeline.
![]()
Comparing Contour Plots
If you would like to see how to create a filled contour plot in Direct Graphics, Coyote Graphics, and IDL 8.1 Function Graphics, you can read the article Comparing Filled Contour Plots.
![]()
Other Contour Plot Articles
- There are a number of contour plots, with IDL code to create them, in the Coyote Plot Gallery.
- How do I contour irregular data on a map projection?
- Why doesn't the NLEVELS keyword to the CONTOUR command give me the correct number of contour levels?
- The colors on my filled contour map projection are completely wrong. What's going on?
- Isn't there a way I can solve all my Contour plot problems?
- Is there a good replacement for the Contour command?
- How can I get rid of this gap in my filled contour plot on a map projection?
- Can you show me how to display a filled contour plot on a map projection?
- Contouring with CELL_FILL is taking forever! Is there a way to speed it up?
- Can you show me how to use Out-of-Bounds colors with filled contour plots?
![]()
Version of IDL used to prepare this article: IDL 7.0.1.
![]()
![]()


