
Specifying the Number of Contour Levels
QUESTION: Why doesn't the NLEVELS keyword to the CONTOUR command give me the number of contour levels I specify?
Editor's Note: Users might be interested in using an alternative contour command that solves all the contour problems described in this article. The cgContour command is part of a suite of device independent graphics commands that are available in the Coyote Library. Also, you are interested in more details about the Contour command, you can now download the entire Contour Plot chapter from David Fanning's new book, Traditional IDL Graphics: Using Familiar Tools Creatively, released in March 2011.
![]()
ANSWER: When I was preparing an article about filled contour plots I realized that although I was asking for 12 contour levels with the NLEVELS keyword, I was getting only nine levels back from the CONTOUR command. So I asked Research Systems technical support staff to clue me in to what was going on.
I learned that contrary to what the IDL on-line documentation claims, the NLEVELS keyword does not divide the data range into "this number of equally-spaced contour intervals." Rather, the number provided by the NLEVELS keyword is treated (I'm not making this up!) as a "suggestion" to the CONTOUR command. The CONTOUR command can apparently do what it likes with the suggestion. Including, as I understand it, put it where the sun don't shine.
I was told by the technical support representative that if I really want 12 contour levels I could either calculate them myself or I could increase the number of levels with the NLEVELS keyword. He didn't have a suggestion as to what I should increase the number to in order to get 12 levels, but presumably a number between 12 and 20 would do it. :-(
In any case, I am now calculating the number of contour intervals myself using code similar to this:
; Get data.
peak = cgDemoData(2)
; Set number of levels.
levels = 12
; Load display colors and set up window.
LoadCT, 33, NColors=levels, Bottom=3
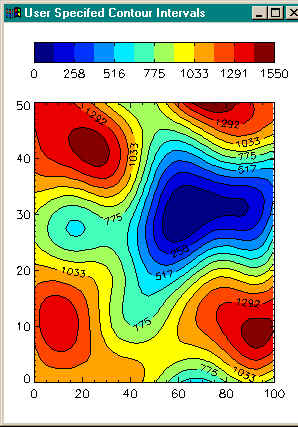
Window, 1, Title='User Specifed Contour Intervals', XSize=300, YSize=400
; Draw the contour plot.
step = (Max(peak) - Min(peak)) / levels
userLevels = IndGen(levels) * step + Min(peak)
SetDecomposedState, 0, CurrentState=state
Contour, peak, /Fill, C_Colors=Indgen(levels)+3, Background=cgColor('white'), $
Levels=userLevels, Position=[0.1, 0.1, 0.9, 0.80], Color=cgColor('black')
Contour, peak, /Overplot, Levels=userLevels, /Follow, Color=cgColor('black')
SetDecomposedState, state
; Draw a colorbar.
cgColorbar, NColors=12, Bottom=3, Divisions=6, $
Range=[Min(peak), Max(peak)], Format='(I4)', $
Position = [0.1, 0.9, 0.9, 0.95], AnnotateColor='black'
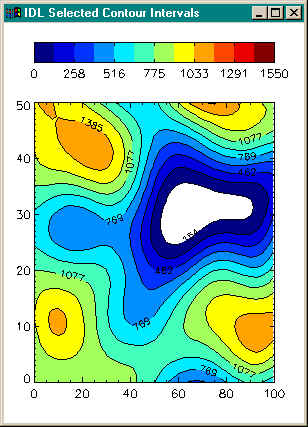
Here is an example (on the left) of what will happen if you set NLevels equal to 12 and (on the right) what will happen if you calculate the 12 levels yourself, as in the code above.
![]()
Last Updated 16 October 2001


