
Browsing MABEL Lidar Data


QUESTION: I see NASA is flying an airborne simulator of a new photon counting Lidar instrument they plan to fly on the ICESAT-2 satellite in 2016. This so-called MABEL data (Multiple Altimeter Beam Experimental Lidar) is available now in HDF-5 format. Do you have any IDL programs to read and browse this Lidar data?
![]()
ANSWER: Yes. Thanks to Michael Lefsky, a long-time IDL user, who heads the Center for Ecological Applications of Lidar (CEAL) at Colorado State University, we have been able to make the IDL programs we have been developing available to the IDL community.
The IDL source code for both of these programs is available in a SourceForge SVN Code Repository. If you don't have an SVN client, you can also download a zip file containing all the necessary code from the same SourceForge page. If you don't have MABEL data and you want to see the program working, you can download an example MABEL data set (8 MByte).
In addition to this code, you will also need a current version of the IDL Coyote Library installed, as these programs are built on top of the Library. The programs should run in any version of IDL from at least IDL 6.4, and possibly earlier. As will all Coyote Library routines, you will need to install the free ImageMagick sofware to be able to produce publication-quality raster output from the programs.
The MabelBrowser Program
The first program we developed is called MabelBrowser. It will allow you to select as many MABEL data files as you like, and will load them into an interface where you can load one file at a time. A channel selection widget allows you to choose any of the channels that are in the file to display. You see a screen shot of the MabelBrowser window below. It is called from within IDL like this.
IDL> MabelBrowser
It can optionally be called with the name of a MABEL data file to open. Otherwise, use the file selection dialog to load one or more files into the interface. You can select multiple files by selecting files with the SHIFT or CRTL key held down.
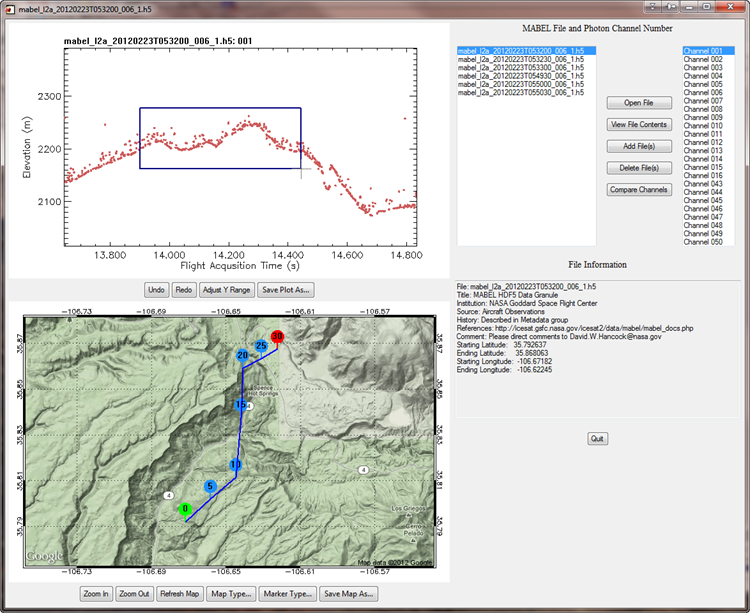 |
| The interface of the MabelBrowser program. The window at the top-left, is a zoom/pan plot that allows you to zoom into the data. The window at the bottom is a cgGoogleMapWidget static image that can be drawn on and navigated. |
The top-left window is a special version of the cgZPlot Coyote Library program that allows the user to zoom into and pan the data file to see as much or as little of the data as desired. Click the LEFT mouse button inside the plot boundaries to draw a rubber-band box to define the portion of dat you want to zoom into. To adjust the zoom amount, click the LEFT mouse button in the plot margins. Clicking in the top or bottom margin will adjust the zoom in or out of the X range by a small amount. Clicking in the left or right margin will do the same thing for the Y axis zoom. Undo and redo buttons save the last 25 plot operations, so you can always recover if you make a mistake.
Once the plot is zoomed in, you can RIGHT click in the window and drag to pan the plot in both the X and Y directions.
The bottom-left window is a Google static map, downloaded from Google at run-time. It is georegistered, so you can draw (as here) map annotations and other information on top of the map. In this picture, the Lidar track is shown with user-defined markers used to indicate every five seconds of Lidar data. Other types of markers are available. And, the map can show terrain (as here), satellite data, a roadmap, or a hybrid road/terrain map. Buttons on the interface allow you to select the map that is best for your purpose.
If you click the LEFT mouse button near a marker, you will adjust X axis location in the top plot to center the marker in the plot window. This gives you a simple way to navigate the Lidar track while still zoomed in close to the data. If you RIGHT click the mouse in the map window, you will center the map at that location. (This is a poor man's panning capability.)
The CompareChannels Program
The CompareChannels program is a companion program to the MabelBrowser. In fact, it can be called by clicking the Compare Channels button on the MabelBrowser interface. But, it can also be run as a stand-alone program. As such, it can be called with the channels you wish to compare like this.IDL> CompareChannels, CHANNELS=[1, 8, 43]
You can either pass a file name to the program as an argument, or select a file with the file selection dialog. You see what the program looks like in the figure below.
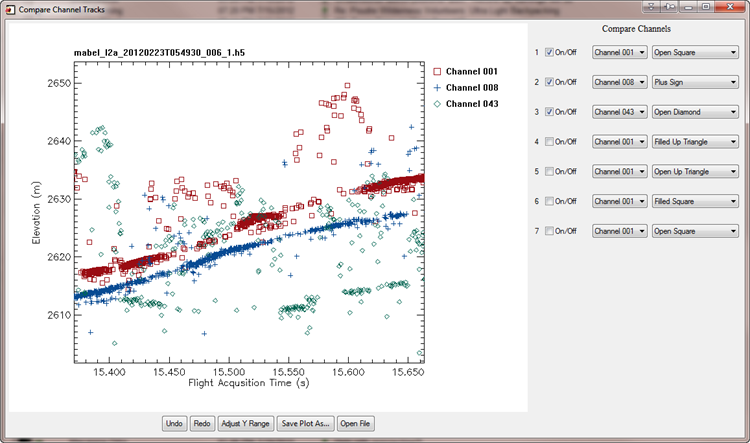 |
| The interface of the CompareChannelsprogram. The user can compare up to seven channels at once. The user can select any channel in the data file to compare. |
The main graphics window is, again, a zoom/pan plotting program that allows the user to zoom into and pan all the data sets at once. Up to seven different channels can be displayed at one time, and the user has the ability to choose any channel in the data set to display. Keywords to the program allow the user to choose which colors and symbols to display the data in, although data symbols can be chosen from the interface, too. This program can be resized to make the drawing window as big as possible.
![]()
Version of IDL used to prepare this article: IDL 7.1.2.
![]()
![]()


