.\
cgboxplot.pro
Graphics
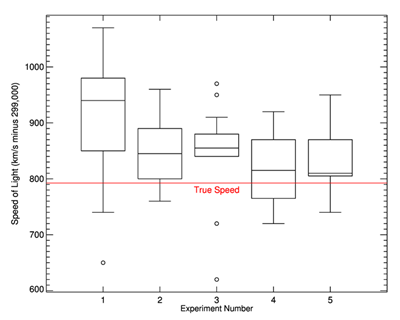
This is graphics routine to display a box plot, also known as a box and whisker plot, in IDL direct graphics. The box encloses the interquartile range (IQR), defined at IQR75-IQR25. The whiskers extend out to the maximum or minimum value of the data, or to the 1.5 times either the IQR75 or IQR25, if there is data beyond this range. Outliers are identified with small circles.
The program requires the Coyote Library to be installed on your machine.
If you wish to draw multiple boxplots in a display window, it will make more sense to use cgLayout to set up your plot positions than to use !P.Multi. This is because the labels on the plot are set up independently of the plot with the XCharsize keyword and this size is not affected by !P.Multi, which normally controls not only the position of plots, but the character size of plot labels, too.
Examples
Here is an example, using data from the Michaelson-Morley speed of light experiment, in which they made five experiments of 20 measurements of the speed of light each. The data can be downloaded from here:
http://www.idlcoyote.com/misc/mm_data.dat
   OpenR, 1, cgFindPathTo('mm_data.dat')
   header = Strarr(2)
   Readf, 1, header
   data = Intarr(5, 20)
   Readf, 1, data
   Close, 1
   cgBoxPlot, data, XTITLE='Experiment Number', YTITLE='Speed of Light'
    data = fltarr(18, 40)
    index = indgen(6)*3
    for j=0,5 do data[index[j],*] = Randomu(seed, 40)*6
    index = index+1
    for j=0,5 do data[index[j],*] = Randomu(seed, 40)*10
    index = index+1
    for j=0,5 do data[index[j],*] = Randomu(seed, 40)*15
    cgPlot, [0,1], /nodata, yrange=[0,16], xrange=[0,19], $
       xtickformat='(A1)', ytitle='Gc(mms-1)', YStyle=1
    index = indgen(6)*3
    width = ((!X.CRange[1] - !X.Crange[0]) / (20)) * 0.75
    cgBoxPlot, data[index, *],/overplot, XLOCATION=index+1, WIDTH=width, $
       BOXCOLOR='rose', /FILLBOX
    cgBoxPlot, data[index+1, *],/overplot, XLOCATION=index+2, WIDTH=width, $
       BOXCOLOR='pale green', /FILLBOX
    cgBoxPlot, data[index+2, *],/overplot, XLOCATION=index+3, WIDTH=width, $
       BOXCOLOR='goldenrod', /FILLBOX
    labels = ['AAA', 'BBB', 'CCC', 'DDD', 'EEE', 'FFF']
    for j=0,5 do cgText, (index+2)[j], -1, labels[j], Alignment=0.5
An article about his program can be found on my web page.
Author information
- Author
FANNING SOFTWARE CONSULTING:
David W. Fanning 1645 Sheely Drive Fort Collins, CO 80526 USA Phone: 970-221-0438 E-mail: david@idlcoyote.com Coyote's Guide to IDL Programming: http://www.idlcoyote.com- Copyright
Copyright (c) 2009, Fanning Software Consulting, Inc.
- History
Change History:
  Written by David W. Fanning, 4 March 2009.
  Added STATS keyword to return data statistics. 5 March 2009. DWF.
  Added MISSING_DATA_VALUE keyword to identify missing values. 14 March 2009. DWF.
  Removed limitation of LABELS array having no more than 28 elements. 14 March 2009. DWF.
  Made it possible to pass a pointer array containing the data, if desired. 14 March 2009. DWF.
  Added ROTATE keyword to rotate labels. 16 March 2009. DWF.
  Added several modifications to guard against ill-formed data in the cgBoxPlot_Draw
    procedure. 23 March 2009. DWF.
  Added keywords FILLBOXES and BOXCOLOR. 24 March 2009. DWF.
  Redefined the STATS structure to include MEAN and to store values as doubles. 25 March 2009. DWF.
  Fixed in a bug that resulted in incorrect behavior when the MISSING_DATA_VALUE keyword
    was used. 8 April 2009. DWF.
  Fixed a typo that didn't allow a single column vector to be displayed as a box plot. 17 May 2009. DWF.
  Now allow a single row vector to be passed into program and displayed. 20 May 2009. DWF.
  Added NOCLIP=0 keyword to PLOTS command when drawing outliers. 15 July 2009. DWF.
  Minor adjustment of the X axis label position. 28 October 2010. DWF.
  Add the ability to change the label character size and thickness via the normal
    XCHARSIZE and XTHICK keywords you would use for a plot. 3 Dec 2010. DWF.
  Fixed a couple of typos, added ADDCMD, CHARSIZE, LAYOUT and WINDOW keywords. 2 Feb 2011. DWF.
  Added the ability to send the output directly to a file via the OUTPUT keyword. 9 Dec 2011, DWF.
  PostScript, PDF, and Imagemagick parameters can now be tailored with cgWindow_SetDefs. 14 Dec 2011. DWF.
  Added XLOCATION and WIDTH keywords. 5 June 2012. DWF.
  The XCharSize keyword was not being used correctly. 2 July 2013. DWF.
  The program was not setting the color state back to the entry state. 22 Nov 2013. DWF.
  Added the fields TOP_WHISKER and BOT_WHISKER to the STATS structure. 23 Nov 2013. DWF.
Routines
result = cgBoxPlot_Prepare_Data(data, missing_data_value)This function prepares the data for display by removing any missing data values from further consideration.
cgBoxPlot_Draw, thisdata [, BOXCOLOR=string] [, COLOR=string] [, /FILLBOXES], OUTLIERCOLOR=OUTLIERCOLOR [, OUTLINECOLOR=string] [, STATS=STATS] [, WIDTH=WIDTH] [, XLOCATION=XLOCATION]Draws the box plot in the display window.
cgBoxPlot, data [, /ADDCMD] [, AXISCOLOR=string] [, BACKGROUND_COLOR=string] [, BOXCOLOR=string] [, CHARSIZE=float] [, COLOR=string] [, /FILLBOXES] [, LABELS=string] [, LAYOUT=intarr(3)] [, MISSING_DATA_VALUE=MISSING_DATA_VALUE] [, OUTFILENAME=string], OUTLIERCOLOR=OUTLIERCOLOR [, OUTLINECOLOR=string] [, OUTPUT=string] [, /OVERPLOT] [, ROTATE=float] [, STATS=STATS] [, XCHARSIZE=float] [, XLOCATION=integer] [, XTHICK=integer] [, WIDTH=float] [, /WINDOW] [, _REF_EXTRA=_REF_EXTRA]This is graphics routine to display a box plot, also known as a box and whisker plot, in IDL direct graphics.
Routine details
top cgBoxPlot_Prepare_Data
result = cgBoxPlot_Prepare_Data(data, missing_data_value)
This function prepares the data for display by removing any missing data values from further consideration.
Parameters
- data in required
The data to be prepared.
- missing_data_value in required
The missing data value that should be found and removed from the data.
top cgBoxPlot_Draw
cgBoxPlot_Draw, thisdata [, BOXCOLOR=string] [, COLOR=string] [, /FILLBOXES], OUTLIERCOLOR=OUTLIERCOLOR [, OUTLINECOLOR=string] [, STATS=STATS] [, WIDTH=WIDTH] [, XLOCATION=XLOCATION]
Draws the box plot in the display window.
Parameters
- thisdata in required
The data to be draw as a box plot.
Keywords
- BOXCOLOR in optional type=string default=rose
If FILLBOXES is set, the IQR box is filled with this color.
- COLOR in optional type=string default=opposite
A string color name, as appropriate for the cgColor program. The boxplot will be drawn in this color.
- FILLBOXES in optional type=boolean default=0
Set this keyword to fill the IQR box with a color, specified by BOXCOLOR.
- OUTLIERCOLOR
The name of the color the outliers are drawn in. By default, the
BoxColor.- OUTLINECOLOR in optional type=string
The color the box outlines are drawn in. By default, the
BoxColorifFillBoxes' isset andColorif not.- STATS in optional
Set this to a named variable that will return an array of structures for each of the columns of data. The statistics are calculated in this routine.
- WIDTH in optional
The width of the box.
- XLOCATION in optional
The x starting location of the box.
top cgBoxPlot
cgBoxPlot, data [, /ADDCMD] [, AXISCOLOR=string] [, BACKGROUND_COLOR=string] [, BOXCOLOR=string] [, CHARSIZE=float] [, COLOR=string] [, /FILLBOXES] [, LABELS=string] [, LAYOUT=intarr(3)] [, MISSING_DATA_VALUE=MISSING_DATA_VALUE] [, OUTFILENAME=string], OUTLIERCOLOR=OUTLIERCOLOR [, OUTLINECOLOR=string] [, OUTPUT=string] [, /OVERPLOT] [, ROTATE=float] [, STATS=STATS] [, XCHARSIZE=float] [, XLOCATION=integer] [, XTHICK=integer] [, WIDTH=float] [, /WINDOW] [, _REF_EXTRA=_REF_EXTRA]
This is graphics routine to display a box plot, also known as a box and whisker plot, in IDL direct graphics. The box encloses the interquartile range (IQR), defined at IQR75-IQR25. The whiskers extend out to the maximum or minimum value of the data, or to the 1.5 times either the IQR75 or IQR25, if there is data beyond this range. Outliers are identified with small circles.
Parameters
- data in required
A two-dimensional array. The data for each box plot will be in the columns of the data array. There will be one box plot drawn for each column in the data array. The maximum column size is 28. As an alternative, data can be a pointer array, in which case there will be one box plot drawn for each valid pointer in the array.
Keywords
- ADDCMD in optional type=boolean default=0
Set this keyword to add the command to the resizeable graphics window cgWindow.
- AXISCOLOR in optional type=string
A string color name, as appropriate for the cgCOLOR program. By default, the same as the COLOR keyword. Used only if OVERPLOT keyword is not set.
- BACKGROUND_COLOR in optional type=string default=white
A string color name, as appropriate for the cgColor program. Used only if OVERPLOT keyword is not set.
- BOXCOLOR in optional type=string
If FILLBOXES is set, the IQR box is filled with this color.
- CHARSIZE in optional type=float
Set this to the character size to use on the plot. If undefined, uses the value of cgDefCharsize().
- COLOR in optional type=string default=opposite
A string color name, as appropriate for the cgColor program. The boxplot will be drawn in this color.
- FILLBOXES in optional type=boolean default=0
Set this keyword to fill the IQR box with a color, specified by BOXCOLOR.
- LABELS in optional type=string
A string array of the same length as the number of columns of data. The boxplots will be labeled with these labels along the X axis. Used only if OVERPLOT keyword is not set.
- LAYOUT in optional type=intarr(3)
This keyword specifies a grid with a graphics window and determines where the graphic should appear. The syntax of LAYOUT is three numbers: [ncolumns, nrows, location]. The grid is determined by the number of columns (ncolumns) by the number of rows (nrows). The location of the graphic is determined by the third number. The grid numbering starts in the upper left (1) and goes sequentually by column and then by row.
- MISSING_DATA_VALUE in optional
Set this keyword to a value that will be used to identify missing data. Missing data is not used in the calculations of the box plot.
- OUTFILENAME in optional type=string
If the
Outputkeyword is set, the user will be asked to supply an output filename, unless this keyword is set to a non-null string. In that case, the value of this keyword will be used as the filename and there will be no dialog presented to the user.- OUTLIERCOLOR
The name of the color the outliers are drawn in. By default, the
BoxColor.- OUTLINECOLOR in optional type=string
The color the box outlines are drawn in. By default, the
BoxColorifFillBoxes' isset andColorif not.- OUTPUT in optional type=string
Set this keyword to the type of output desired. Possible values are these:
Or, you can simply set this keyword to the name of the output file, and the type of file desired will be determined by the file extension. If you use this option, the user will not be prompted to supply the name of the output file.'PS' - PostScript file 'EPS' - Encapsulated PostScript file 'PDF' - PDF file 'BMP' - BMP raster file 'GIF' - GIF raster file 'JPEG' - JPEG raster file 'PNG' - PNG raster file 'TIFF' - TIFF raster fileAll raster file output is created through PostScript intermediate files (the PostScript files will be deleted), so ImageMagick and Ghostview MUST be installed to produce anything other than PostScript output. (See cgPS2PDF and cgPS_Close for details.) And also note that you should NOT use this keyword when doing multiple plots. The keyword is to be used as a convenient way to get PostScript or raster output for a single graphics command. Output parameters can be set with cgWindow_SetDefs.
- OVERPLOT in optional type=boolean default=0
If this keyword is set, the boxplots will be overdrawn on the current set of axes. The X axis will be presumed to be scaled from 0 to 1 more than the number of columns in data.
- ROTATE in optional type=float default=0.0
Set to a value between -90 and 90 degree. The labels will be rotated this amount. Positive values rotate in CCW fashion, negative values in CW fashion.
- STATS out optional
Set this to a named variable that will return an array of structures for each of the columns of data. The structure will be defined as this:
struct = { Median:0.0D, Mean: 0.0D, Min:0.0D, Max:0.0D, $ Q25:0.0D, Q75:0.0D, IQR:0.0D, SDEV:0.0D, N:0L, $ Top_Whisker:0.0D, Bot_Whisker:0.0D }
Where "mean" is the median value of the data, "Q25" and "Q75" are the 25th percent quartile and 75th percent quartile of the data, repectively, "IRG" is the Interquartile Range, SDEV is the standard deviation, and N is the number of points used to construct the box plot.
- XCHARSIZE in optional type=float default=1.0
The size of the X axis labels.
- XLOCATION in optional type=integer
The X location where the data should be plotted. Can be an array the save size as the first dimension of data. Normally, this is an integer from 1 to the number of boxplots that are on the final plot.
- XTHICK in optional type=integer default=1
The thickness of the X axis labels.
- WIDTH in optional type=float
The "width" of each box plot in data units. The default is calculated from the X axis range and the number of boxes to draw on the plot like this: ((!X.CRange[1] - !X.Crange[0]) / (numbox+2.0)) * 0.9.
- WINDOW in optional type=boolean default=0
Set this keyword to display the plot in a resizeable graphics window (cgWindow).
- _REF_EXTRA in optional
Any keyword appropriate for the cgPlot command is also accepted by keyword inheritance.
File attributes
| Modification date: | Fri Mar 27 11:07:36 2015 |
| Lines: | 856 |
| Docformat: | rst rst |