
Ephemeral Map Structures
QUESTION: I've been using Map_Proj_Init to create a GCTP map projection structure, and then using that map structure with Map_Continents to draw continental outlines on my map. Most of the time this works great, but occasionally when I plot the continents they appear to be plotted with a completely different map projection! Is this a sign that I am going crazy?
![]()
ANSWER: Uh, no, you are not going crazy. There is absolutely no mention of this in the IDL documentation, but the map structure produced with Map_Proj_Init for the GCTP map projections is ephemeral. That is to say, the map structure is a valid representation of the map projection created by Map_Proj_Init, right up and until you issue a second Map_Proj_Init command. At that point, the map structure created by the first command turns into the map structure created by the second command by a spooky action-at-a-distance method that is not completely understood. It is not completely clear to me if the map structure completely turns into the new map structure, or it only partially turns into the new map structure, but either way, it pretty much renders the old map structure worthless for rendering graphics on maps.
Here is an example. Suppose I wish to make a Lambert's Equal Area projection, centered on the north pole, and I would like to display the continents and a map grid. I could do so like this.
     cgDisplay, 350, 350, TITLE='What I expect'
     mapStruct = Map_Proj_Init(111, /GCTP, DATUM=8, CENTER_LATITUDE=90, $
                         CENTER_LONGITUDE=0, LIMIT=[0, -180, 90, 180])
     cgPlot, mapStruct.uv_box[[0,2]], mapStruct.uv_box[[1,3]], $
           /NoData, XSTYLE=5, YSTYLE=5, POSITION=[0,0,1,1]
     cgMap_Continents, MAP_STRUCTURE=mapStruct, /FILL, COLOR='saddle brown'
     cgMap_Grid, MAP_STRUCTURE=mapStruct, COLOR='charcoal', /LABEL
You see the result in the figure below.
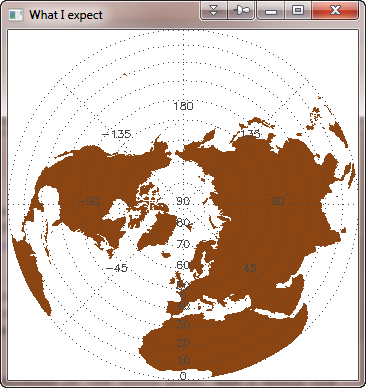 |
| The map structure used to create the map projection I expect. |
But now I issue another Map_Proj_Init command. In this case, I will just rotate the projection. Notice here I am not even saving the map structure that is returned by Map_Proj_Init in a variable!
    Print, Map_Proj_Init(111, /GCTP, DATUM=8, CENTER_LATITUDE=90, $
                         CENTER_LONGITUDE=135, LIMIT=[0, -180, 90, 180])
After issuing this second Map_Proj_Init command, I wish to replot my first map projection plot, so I re-issue these commands.
     cgPlot, mapStruct.uv_box[[0,2]], mapStruct.uv_box[[1,3]], $
           /NoData, XSTYLE=5, YSTYLE=5, POSITION=[0,0,1,1]
     cgMap_Continents, MAP_STRUCTURE=mapStruct, /FILL, COLOR='saddle brown'
     cgMap_Grid, MAP_STRUCTURE=mapStruct, COLOR='charcoal', /LABEL
You see the result below. My plot, which was not connected to the second Map_Proj_Init command in any way, is now plotting as if I was using the second Map_Proj_Init map structure. Weird!
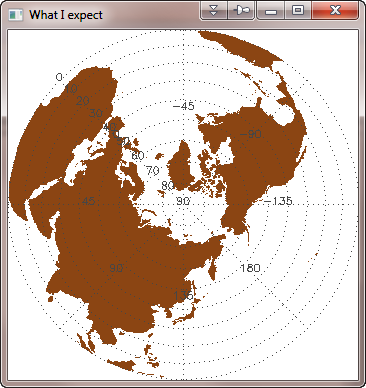 |
| The same graphics commands now use spooky action at a distance methods to produce the second map projection, not the first. |
![]()
Map Coordinate Object
This spooky action-at-a-distance can be especially troubling if you are working with map projections in widget programs that allow different map projections. It is entirely possible for one widget program to affect how the graphics are displayed in a completely different program! I have been bitten by this, uh, let's call it a feature, too many times, so I thought I would do something about it. I have created a map coordinate object, named cgMap that I now use to put map boundaries, grids, and other graphics onto images. The map coordinate object sets up a map data space (usually on top of an image) to draw into. The routines that draw on maps (cgMapContinents, cgMapGrid, and cgMapPlots) can use the cgMap object to produce a fresh map structure each and every time they draw their graphics.
This all works because cgMap is (essentially) a wrapper for the Map_Proj_Init command in IDL. That is to say, you initialize the cgMap object using the very same keywords and parameters you use with Map_Proj_Init. (There are other keywords as well for other purposes.) The advantage of this is that the object then knows how to "reissue" the Map_Proj_Init command to produce a map structure any time it is needed. In fact, if you call the GetMapStruct method on the cgMap object, it will return the map structure created by immediately executing a Map_Proj_Init command. Note the cgMap object is a bit more limited than Map_Proj_Init, in that only GTPC map projections are allowed. I lost confidence in the normal IDL map projections (i.e., those normally called with Map_Set) when I started working with map projections professionally.
The objects that I have described are all part of the Coyote Graphics suite of map projection routines.
Example Using the cgMap Object
Here is an example of how I use the cgMap object. I am going to use an image from the DMSP SSM/I Pathfinder satellite, which produces microwave brightness temperatures that the National Snow and Ice Data Center (NSIDC) grids onto an EASE-Grid sphere with a Lambert Equal Area map projection. You can download a zipped image from the NSIDC web page if you wish to follow along. There is no need to unzip the file, we will read it directly in its compress form into IDL.
This particular image is a unsigned integer array of size 1441 by 1441. We can read the data like this.
   file = "EASE-F13-NH2007002A.85V.gz"
   image = UIntArr(1441, 1441)
   OpenR, lun, file, /GET_LUN, /COMPRESS, /SWAP_IF_BIG_ENDIAN
   ReadU, lun, image
   Free_Lun, lun
The data needs to be divided by 10 to be scaled properly, and NSIDC images are gridded with the (0,0) pixel of the image in the upper-left, rather than using IDL's convention of locating the (0,0) pixel at the lower-left of the image. This means we need to reverse the image, as well. .
image = Reverse(image, 2) / 10.0
A quick look at the minimum and maximum values in this image (you can use the MaxMin command) shows the minimum to be 0 and the maximum to be 296.2. Thus, we will have to scale the image to display it properly. For a quick look, we can do this.
   cgDisplay, 400, 400
   cgLoadCT, 4, /BREWER
   cgImage, image, /KEEP_ASPECT, /SCALE
You see the result in the figure below. The smalll hole in the center is the North Pole, and the image covers the northern hemisphere of the Earth. It is not immediately obvious what you are looking at, so it would be nice to display this image with map boundaries and a map grid so you can orient yourself.
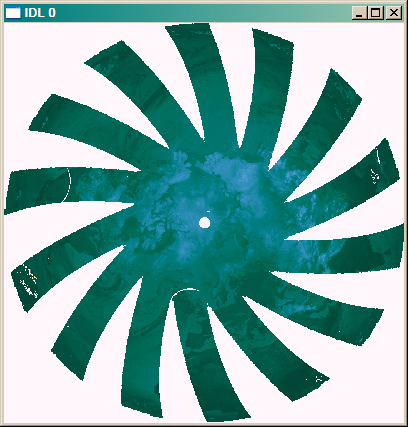 |
| The SSM/I image from the DMSP satellite showing microwave brightness temperatures. |
The first thing we need to do is to create a map coordinate object that represents a Lambert Equal Area projection, centered at the North Pole, using a spherical datum with an Earth radius of 6371228.0 meters (the definition of an EASE-Grid spherical datum), and limited to the northern hemisphere. We do it like this. We set the OnImage keyword so that the map coordinate will set its position from the last position used by cgImage.
   map = Obj_New('cgMap', 'Lambert Azimuthal', SPHERE_RADIUS=6371228.0, CENTER_LONGITUDE=0.0, $
         CENTER_LATITUDE=90.0, LIMIT=[0.,-180., 90.0, 180.0], POSITION=[0.0, 0.0, 1.0, 1.0], /OnImage)
Calling the Draw method of the cgMap object will set up the map data space for us, positioned so that the coordinate space fills the display window (as our image does). But nothing is drawn in it. That is the role of cgMapContinents and cgMapGrid. Let's create them next. (These can actually be created at the same time you create the cgMap object, simply by setting the Continents and Grid keywords. Other keywords select various properties for these objects.)
   continents = Obj_New('cgMapContinents', map, COLOR='indian red')
   grid = Obj_New('cgMapGrid', map, COLOR='charcoal', /AUTODRAWGRID)
We will add the two drawing objects to the map coordinate object, so that these objects get drawn (have their Draw method executed) when the map coordinate Draw method is executed. We add them, in the order in which we want them to be drawn, to the cgMap object by calling the AddOverlay method.
   map -> AddOverlay, continents
   map -> AddOverlay, grid
Now we can display map annotations on top of the image.
map -> Draw
You see the results in the figure below.
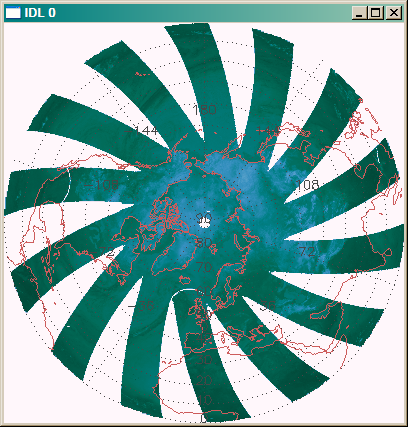 |
| The SSM/I image from the DMSP satellite showing microwave brightness temperatures with map boundaries and grid. |
If you wish to display this image in a resizeable graphics window, you can write code like this.
   cgWindow, WASPECT=1.0
   cgImage, image, /KEEP_ASPECT, /SCALE, /ADDCMD
   map -> AddCmd
You see the results in the figure below.
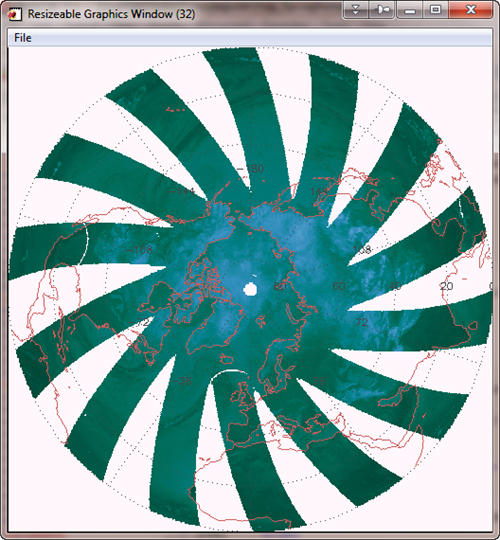 |
| The image in a resizeable graphics window with map boundaries and grid. |
You are now free to have as many resizeable graphics windows up as you like, each with an image in its own map projection, and you will have no fear of that maddening action-at-a-distance!
![]()
Version of IDL used to prepare this article: IDL 7.0.1.
![]()
![]()
Last Updated: 20 November 2011


